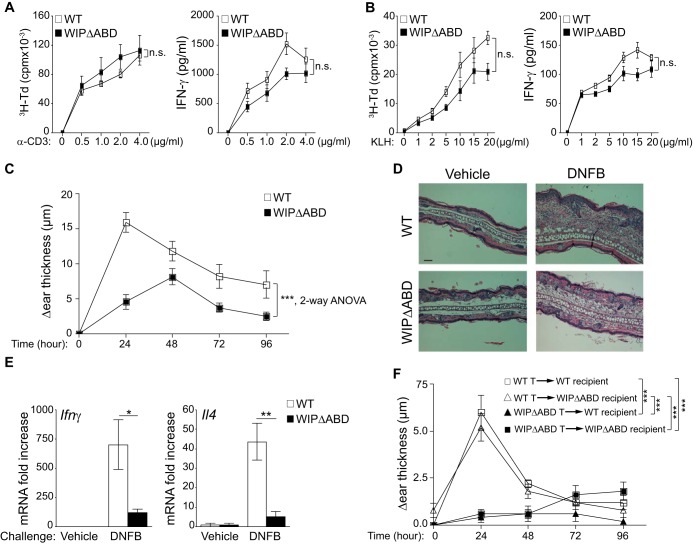
FIG 4.
Defective CHS response in WIPΔABD mice. (A) Proliferation and IFN-γ production by T cells from WIPΔABD mice and WT controls stimulated with an increasing dose of plate-bound anti-CD3 MAb (n = 6 for each group). (B) Proliferation and IFN-γ production in response to KLH by splenocytes from WIPΔABD mice and WT controls i.p. immunized with KLH (n = 6 for each group). (C) CHS in WIPΔABD mice and WT controls measured as the difference in thickness between DNFB- and vehicle-challenged ears (n = 12 for each group). (D) Representative ear skin histology stained with H&E 24 h after challenge with DNFB or vehicle and then visualized by light microscopy. Bar, 50 μm. (E) Ifnγ and Il4 mRNA expression in the ears of WIPΔABD mice and WT controls at 24 h after challenge with DNFB or vehicle. The data are represented as the fold increase in mRNA levels relative to vehicle-challenged ears of WT mice set at 1 (n = 5 for each group). (F) CHS in WIPΔABD and WT mice recipients of WT or WIPΔABD T cells purified from mice sensitized with DNFB (n = 5 for each group). Columns or squares and bars represent means ± the SEM. ***, P < 0.0001; **, P < 0.01; *, P < 0.05; n.s., not significant.

