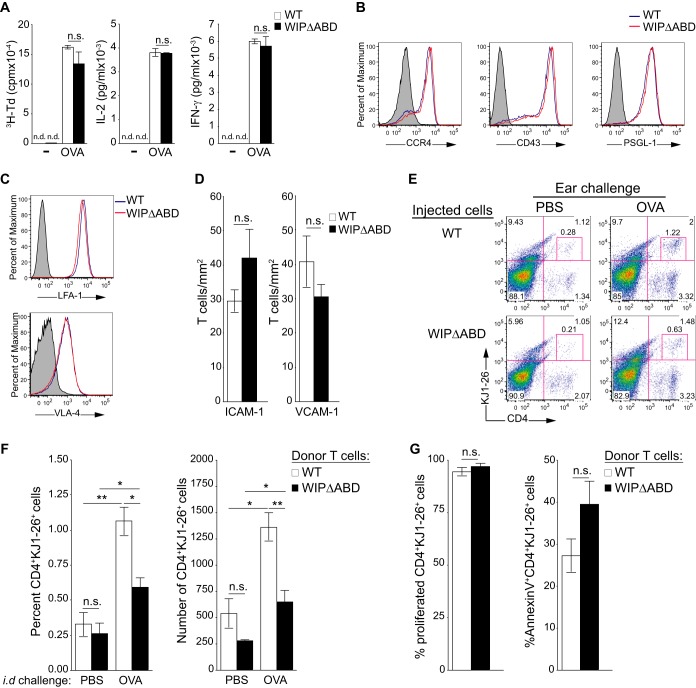
FIG 6.
Defective homing of adoptively transferred WIPΔABD CD4+ T cells to cutaneous sites of Ag challenge in WT recipient mice. (A) Tritiated thymidine (3H-Td) proliferation and IL-2 and IFN-γ production by splenocytes from WIPΔABD and WT mice on the DO11.10 background after stimulation with OVA (n = 5 for each group). n.d., not detected. (B and C) Representative FACS analysis of OVA-stimulated splenic CD4+ T cells from WIPΔABD and WT mice on the DO11.10 background for surface expression of CCR4, CD43, and PSGL-1 (B) and integrins LFA-1 and VLA-4 (C) (n = 5 for each group). The solid gray curve in the histogram represents the isotype control. (D) Adhesion of OVA-stimulated splenic CD4+ T cells from WIPΔABD and WT mice on the DO11.10 background to ICAM-1 and VCAM-1 under conditions of physiologic shear stress flow (1 dyn/cm2; n = 2 for each group). (E) Representative FACS analysis of CD4+ KJ1-26+ cells in OVA- and PBS-challenged ears from WT recipients of OVA-stimulated CD4+ cells derived from DO11.10 WIPΔABD or WT mice. (F) Percentages and numbers of CD4+ KJ1-26+ cells in OVA- and PBS-challenged ears from WT recipients of OVA-stimulated CD4+ cells derived from DO11.10 WIPΔABD or WT mice (n = 5 for each group). (G) Percentages of cells that have proliferated, as determined by dilution of CellTrace Violet (left panel), and of annexin V+ cells (right panel) among CD4+ KJ1-26+ cells in OVA-challenged ears from WT recipients of OVA-stimulated CD4+ cells derived from DO11.10 WIPΔABD or WT mice (n = 4 for each group). Columns and bars represent means ± the SEM. **, P < 0.01; *, P < 0.05; n.s., not significant.

