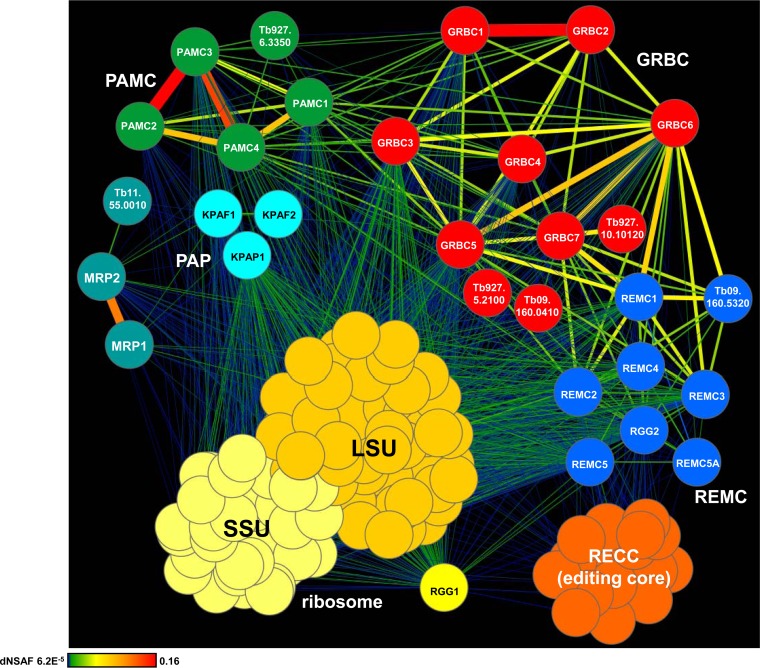
FIG 2.
Interaction network of mitochondrial RNA processing complexes. The network of RNase-resistant interactions was generated in Cytoscape software from bait-prey pairs in which the prey protein was identified with at least 4 unique peptides (see Table S1 in the supplemental material). The edge thickness and color intensity correlate with dNSAF values for bait-prey interactions. For clarity, reciprocal contacts (i.e., bait-bait interactions captured in both purifications) are depicted by a single edge as the sum of two dNSAF values. Color-coded complexes were grouped based on the dNSAF values for each bait-prey pair. The highest dNSAF value corresponds to a GRBC1-GRBC2 direct interaction, which was recapitulated in vitro (18). Gene identifiers (ID) (http://tritrypdb.org) are shown for the proteins detected in the respective complexes with high confidence but not investigated further in this study. SSU, small subunit.

