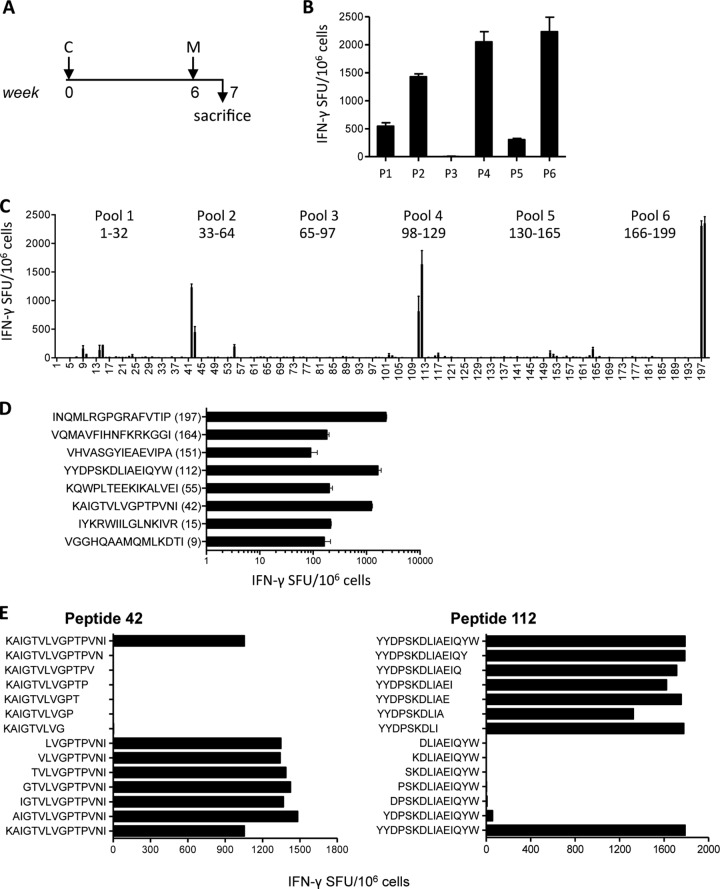
FIG 2.
Breadth, magnitude, and fine specificity of T-cell responses induced by the HIVconsv vaccines. (A) Immunization schedule of BALB/c mice: C and M represent 108 vp of ChAdV63.HIVconsv and 106 PFU of MVA.HIVconsv, respectively. (B and C) Splenocytes were tested for IFN-γ production in an ELISPOT assay upon restimulation with peptide pools P1 to P6 (B) or individual 15/11 HIVconsv peptides derived from the HIVconsv immunogen (C). Data in panel B are represented as means ± standard errors of the means, n = 4 (mice); panel C shows means ± standard errors of the means, n = 3 (triplicate of pooled samples), with one-way ANOVA, P < 0.0001. (D) An independent experiment using the same CM regimen for immunization confirmed responses induced to the 8 peptides identified in panel C with the one-way ANOVA, P < 0.0001. (E) Mapping of minimal epitopes for peptide 42, corresponding to Gag amino acids 126 to 140, and peptide 112, corresponding to Pol amino acids 174 to 186/560-561 (containing a two-region junction), of the HXB2 sequence using progressively truncated peptides in an IFN-γ ELISPOT assay. Pooled splenocyte samples were employed as effectors.

