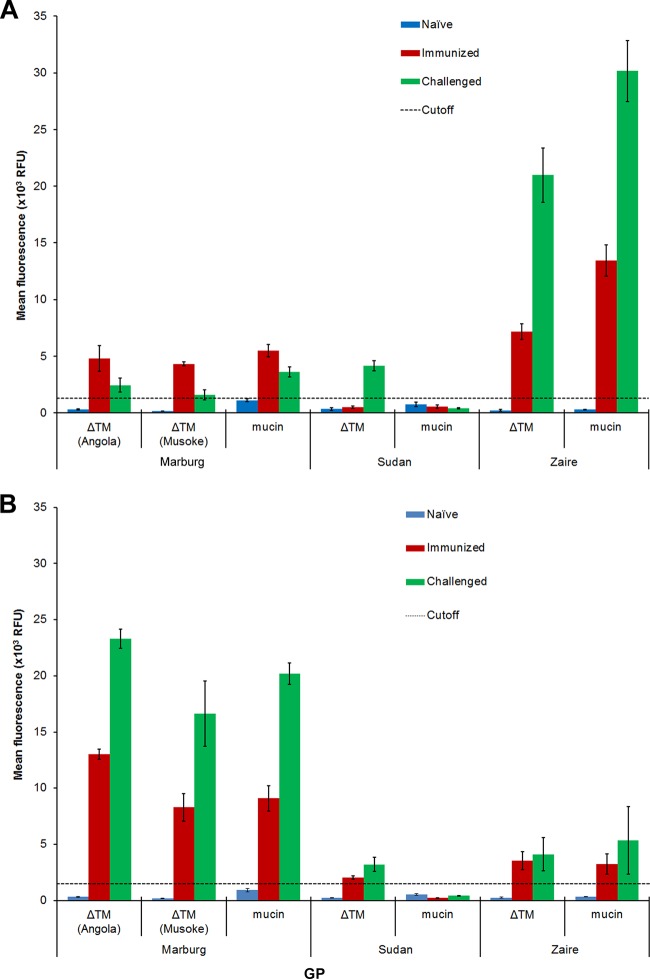
FIG 3.
Comparison of antibody signals between E. coli- and eukaryotic cell-expressed GPs. Data were acquired and analyzed in a manner similar to that for Fig. 2. The bars represent normalized mean fluorescence (RFU) ± SEM. All GP mucins were expressed in E. coli. All GP ΔTM were expressed in insect cells except for Marburg GP ΔTM (Musoke), which was expressed in mammalian cells. (A) Zaire ebolavirus study; (B) Marburg marburgvirus study.

