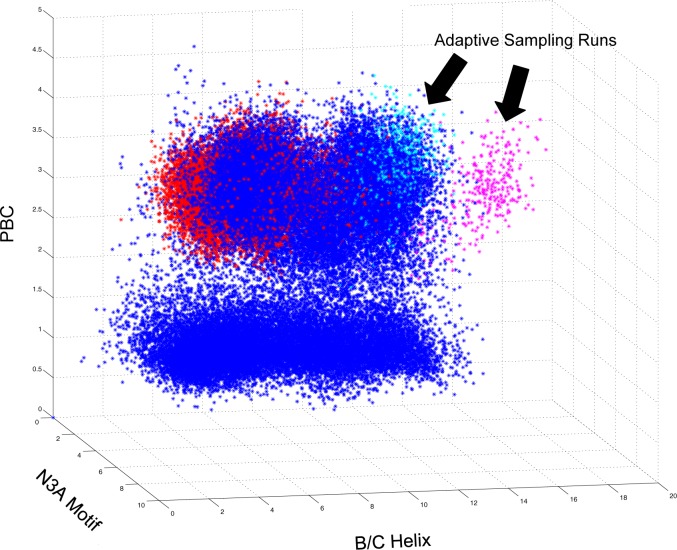
Figure 2.
Example conformational space exploration of apo CBD plotted relative to holoenzyme conformation of two 10 ns adaptive sampling runs. MD simulations were started in either the cAMP bound conformation (red dots) or holoenzyme conformation (blue dots). Adaptive sampling runs, indicated by black arrows, were started from frames form trajectory started in either cAMP bound conformation (magenta dots) or holoenzyme conformation (cyan dots) Each point represents a conformational snapshot (i.e., frame) from the MD trajectories plotted based on the RMSD from the crystallographic structure of three CBD structural motifs, the phosphate binding cassette (PBC), the N3A motif, and the B/C helix, that characterize the conformational change in the CBD.

