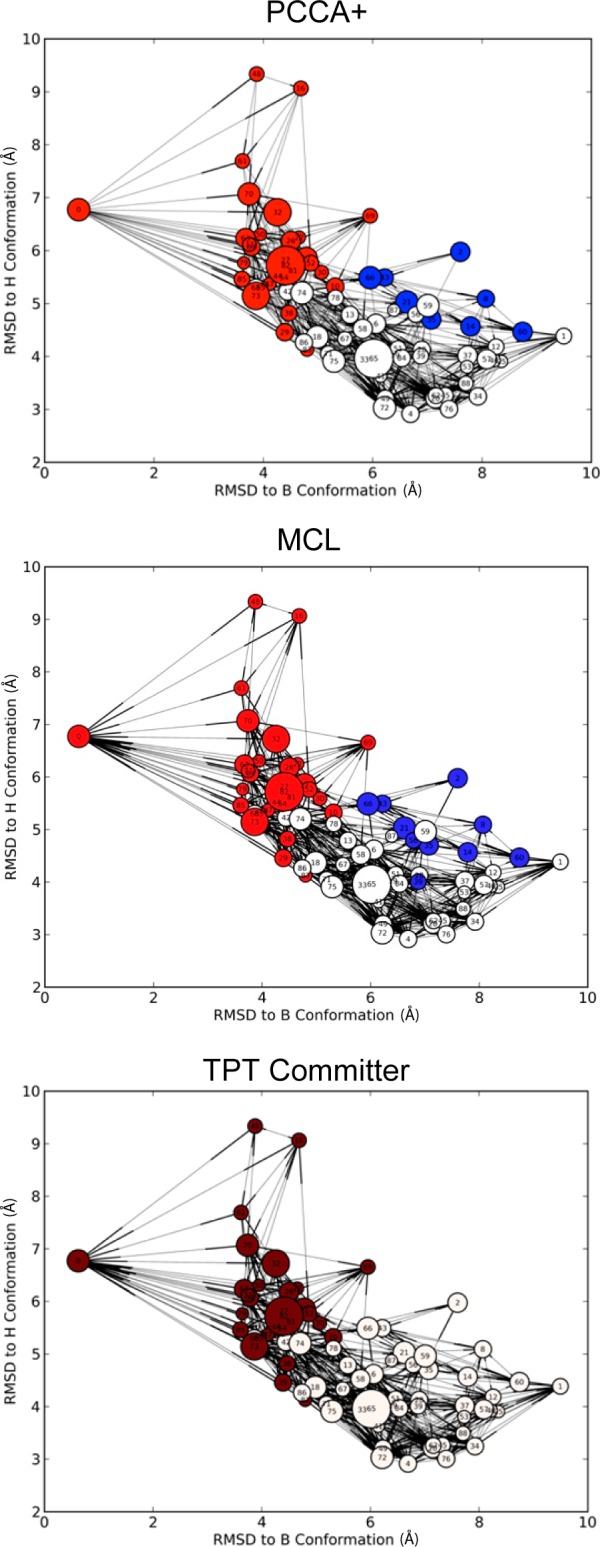
Figure 4.

Sample comparison of PCCA+, MCL, and TPT committer macrostate models. Color-coding of the microstates identifies macrostate membership. Microstate nodes are plotted based on the RMSD of the cluster generator from two reference structures and the node diameters are proportional to the log of their proportional equilibrium population.
