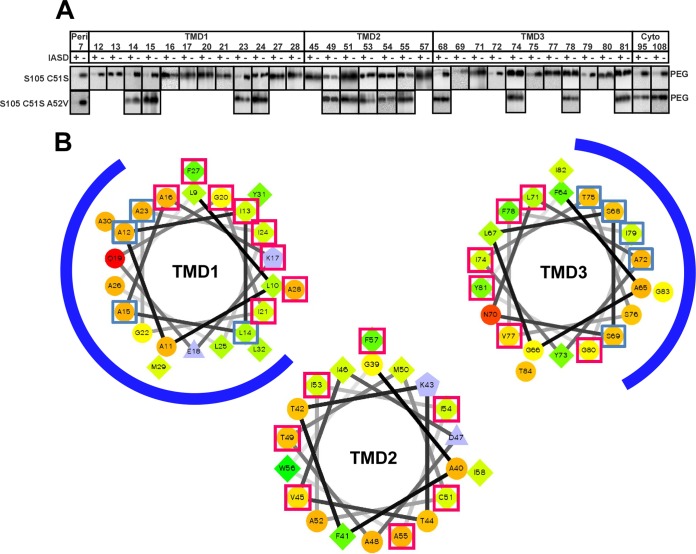
FIG 4.
IASD protection analysis of S105. (A) Immunoblot analysis, as described in Materials and Methods. ‘‘PEG'' indicate the positions of the PEGylated species. IASD protection is indicated by an IASD-dependent decrease in the PEGylated species. (B) IASD-protected positions in TMD1, -2, and -3 map to the most hydrophilic face. Helical projections of all three TMDs are shown, with hydrophilic residues represented as circles, hydrophobic residues as diamonds, acidic residues as triangles, and basic residues as pentagons. Hydrophobicity is also color coded: the most hydrophobic residue is green, and the green becomes lighter with decreasing hydrophobicity, with zero hydrophobicity coded as yellow. The charged residues are light blue. The blue and red boxes indicate positions modified and not modified by IASD, respectively. The blue arcs indicate the lumen faces of TMD1 and TMD3.

