Figure 4.
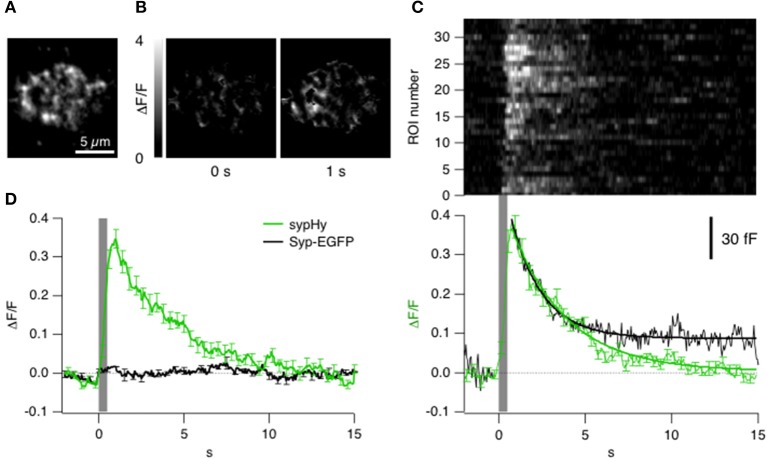
Kinetics of vesicle fusion and retrieval observed with sypHy. (A) Average fluorescence projection (before stimulation) of TIRF image of the synaptic terminal of a bipolar cell expressing sypHy. (B) Images showing the relative changes in fluorescence at different time points from the start of a stimulus lasting 0.5 s. These images have been backgroud subtracted and it was calculated the ΔF/F (variation of fluorescence to the F0 = basal fluorescence). (C) Top: Raster plot showing the kinetics of the sypHy signal in 33 ROIs from the footprint in (B). Note the variability in time-course of recovery. Bottom: The average kinetics of the sypHy signal triggered by the same stimulus (green, 7 terminals). The black trace shows the time-course of the capacitance signal measured in zebrafish bipolar cell terminals in response to a 0.5 s depolarization (n = 3). (D) Comparison of the sypHy signal (green; 3 terminals) and synaptophysin-EGFP signal (black; 2 terminals) triggered by a 0.5 s stimulus. Traces in (C,D) were normalized to the maximum intensity of relative change in fluorescence. All of the sypHy signal can be attributed to vesicle fusion and subsequent events.

