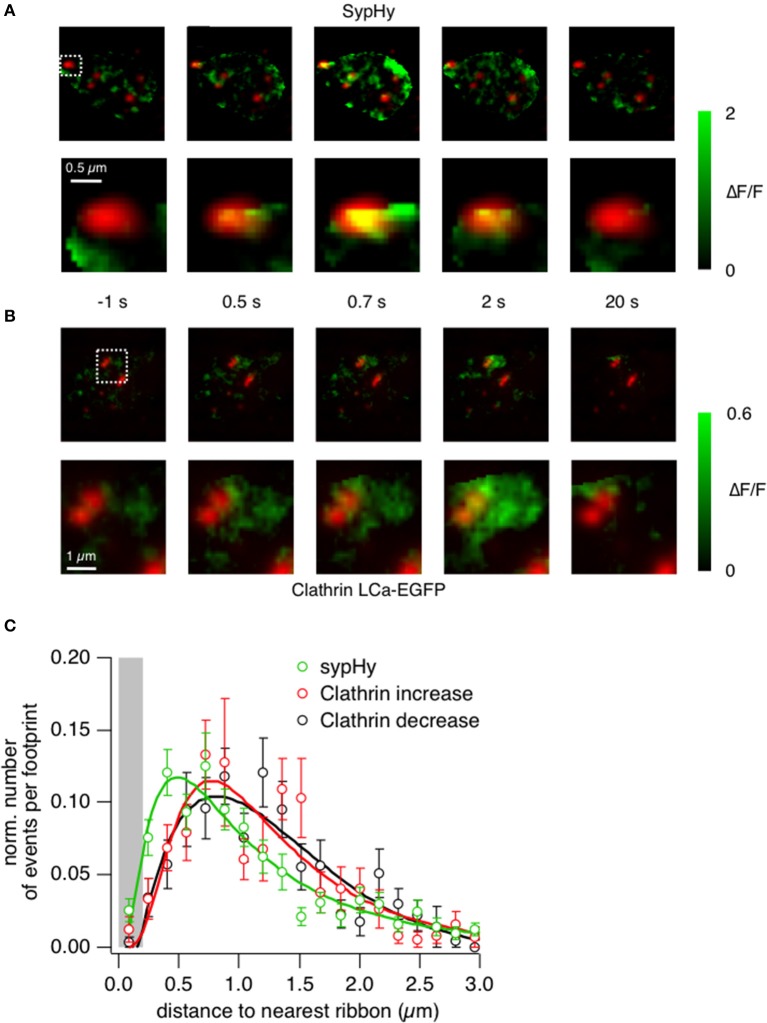
Figure 6.
Clathrin accumulates at the periphery of the active zone. (A) TIRF imaging of the synaptic terminal of a bipolar cell expressing sypHy and ribeye-mCherry. Images show the relative change in fluorescence at times indicated relative to the start of a depolarizing stimulus lasting 0.5 s. The lower sequence is zoomed into the area marked by the square. Note that the signal generated in the first 0.5 s is closely localized to the active zone. (B) TIRF imaging of clathrin LCa-EGFP and ribeye-mCherry. The lower sequence is zoomed into the area marked by the square. Images obtained at the times corresponding to the experiment in (A). Note that the signal generated in the first 0.5 s is around the active zone rather than immediately under it. (C) The position of vesicle fusion events (green) and regions of clathrin accumulation (red), relative to the center of the ribbon. The average radius of a ribbon was ~200 nm (as shown by the gray bar). Note that clathrin tends to accumulate and disappear further away than the initial sites of vesicle fusion.

