
Figure 4.
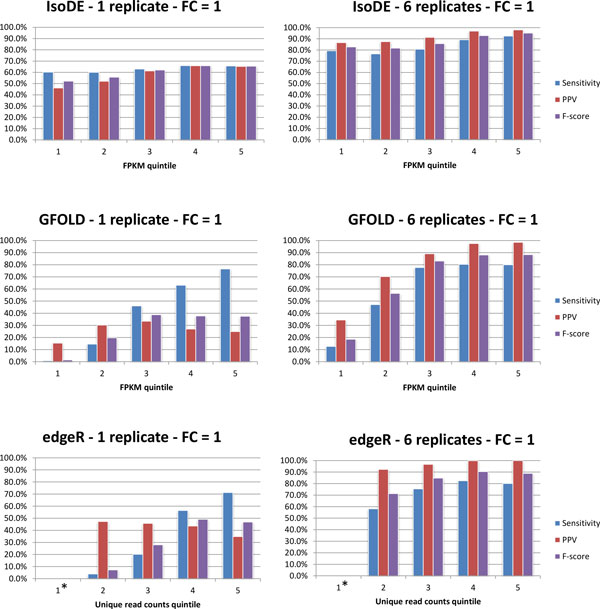
Sensitivity, PPV, and F-Score of IsoDE-All (with 20 bootstrap runs per condition), edgeR, and GFOLD on the Illumina MCF-7 data, computed for quintiles of expressed genes after sorting in non-decreasing order of average FPKM for IsoDE and GFOLD and average count of uniquely aligned reads for edgeR. First quintile of edgeR had 0 differentially expressed genes according to the ground truth (obtained by using all 7 replicates).