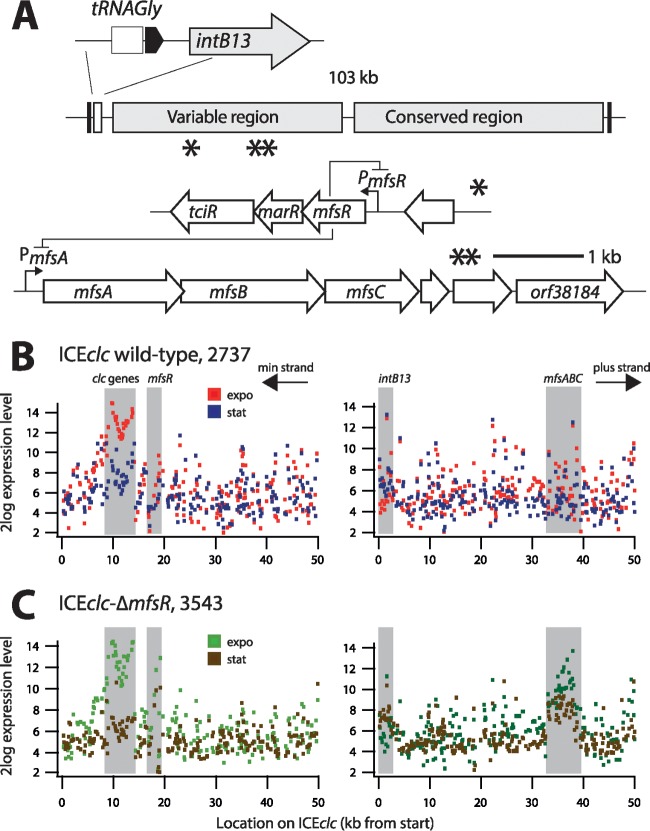
FIG 1.
Genetic map of ICEclc and the relevant regions for microarray analysis. (A) ICEclc schematic representation. Arrows indicate predicted open reading frames and their orientation. Single and double asterisks depict the locations of mfsR-marR-tciR and mfsABC-orf38184, respectively. (B and C) Log 2-fold mean expression level of ICEclc genes in P. putida UWC1 carrying ICEclc (strain 2737) and ICEclc-ΔmfsR (strain 3543), respectively. RNA was harvested from cells in exponential phase growing with 10 mM 3-CBA as the sole carbon and energy source and in subsequent stationary phase. Diagrams display mean expression levels from triplicate microarrays for probes plotted along the length of ICEclc (kb) on both strands (labeled “min” and “plus”). Gray-shaded zones indicate expression in the regions of the intB13 integrase gene, the clc genes for 3-chlorocatechol metabolism, mfsR, and mfsABC.

