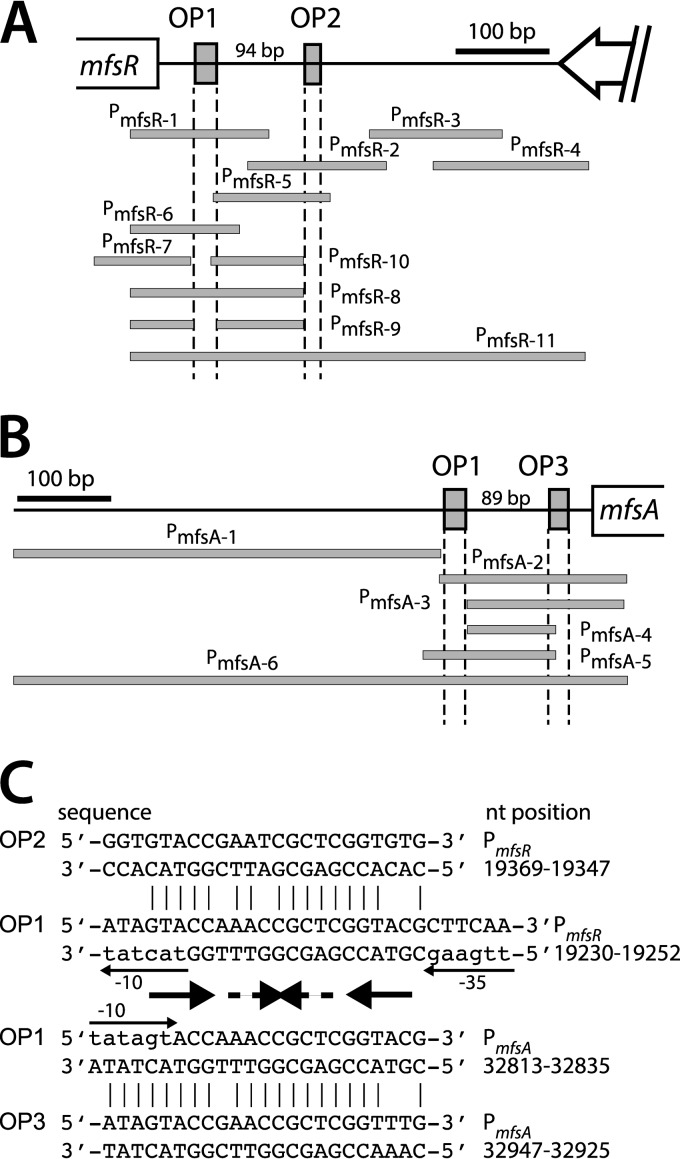
FIG 2.
Overview of the studied mfsR and mfsA promoter regions. (A) PCR-amplified and cloned promoter fragments upstream of mfsR (gray bars). The OP1 sequence was deleted in fragment PmfsR-9. (B) Cloned promoter fragments upstream of mfsA. Gray boxes represent MfsR operator sequences (OP1, OP2, and OP3). (C) Details of the OP sequences in the mfsR and mfsA promoter regions. Palindromic sequences within the OP1 box are indicated by thick arrows (5′-GTACCNANCNGNTNGGTAC, of which OP2 and OP3 share only the first part, 5′-NNACCGAN5TCGGTAC). Thin arrows point to the −35/−10 motifs and transcription direction in the OP1 box of the mfsR promoter and the reverse −10 motif and transcription direction within OP1 in PmfsA. Nucleotide positions refer to numbering of ICEclc in GenBank (accession number AJ617740.2). For the complete sequence, see Fig. S2 in the supplemental material.

