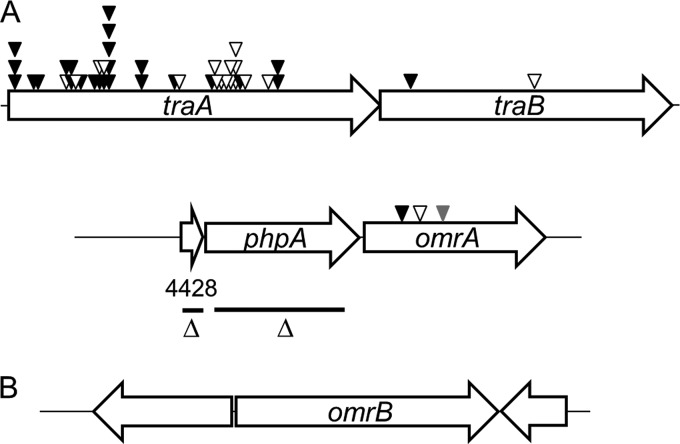
FIG 2.
Genetic maps of discovered genes. (A) Transposon insertions isolated in traA (MXAN_6895), traB (MXAN_6898), and omrA (MXAN_4426) are shown. Black, white, and gray triangles, mariner, Tn5, and EZ-Tn5 transposon insertions, respectively. In-frame deletion (Δ) regions in phpA (MXAN_4427) and MXAN_4428 are indicated as black bars. (B) Genetic organization of the omrB (MXAN_6818) locus. Genes are drawn approximately to scale.

