FIG 5.
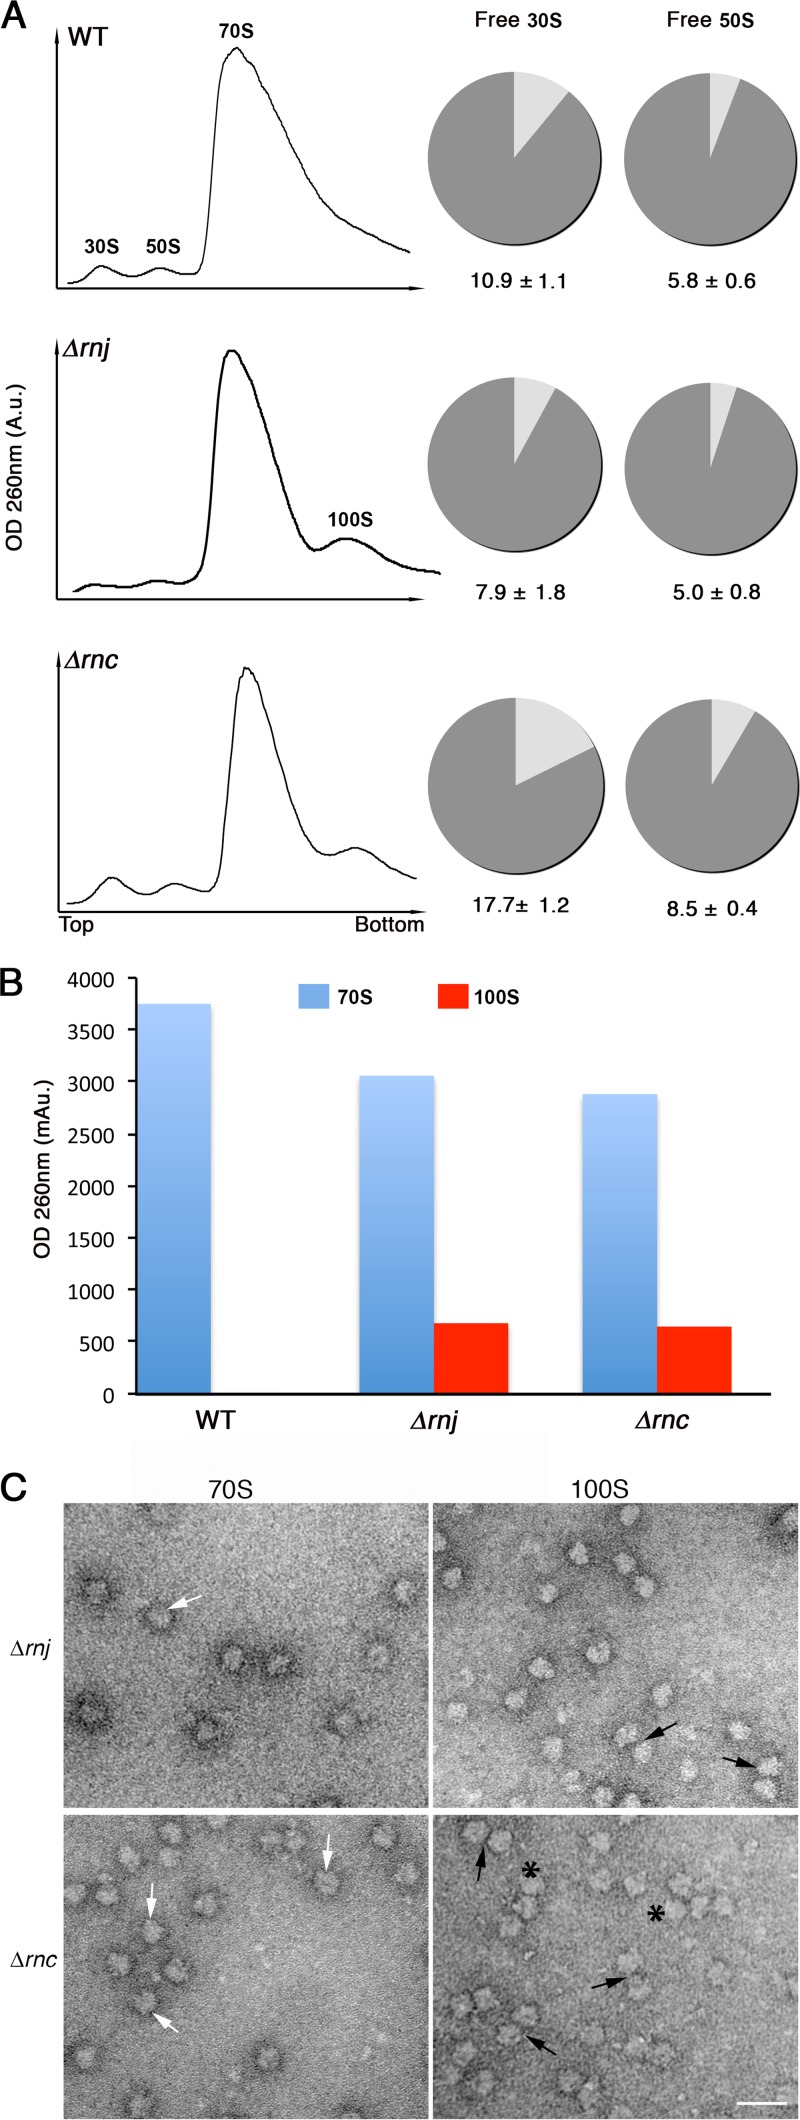
Ribosome profiling of wild-type and RNase mutant strains. (A) Ribosomes from wild-type (top), Δrnj (middle), and Δrnc (bottom) strains were fractionated on 10 to 30% sucrose gradients, and sedimentation profiles were plotted (left). Peaks corresponding to 30S and 50S ribosomal subunits, 70S ribosomes, and 100S ribosome dimers are indicated. The pie graphs to the right depict the proportion of free and complexed subunits in wild-type and RNase mutant strains in the same order as that on the left. The proportion of free 30S to bound 30S (i.e., 30S subunits in 70S and 100S ribosomes) and free 50S to bound 50S (i.e., 50S subunits in 70S and 100S ribosomes) in the wild-type and mutant strains was calculated using peak areas obtained from the sucrose gradient profiles (left). A.u., arbitrary units. (B) Plot representing the amount of 70S and 100S particles obtained from the profiles shown in panel A. (C) Electron micrographs of images corresponding to 70S peaks and the additional peaks from Δrnj and Δrnc strains. Peak fractions were pooled separately (i.e., 70S fraction and 100S fraction), purified, and visualized using transmission electron microscopy. 70S and 100S ribosomal particles are indicated by white and black arrows, respectively. Polysomes are indicated by asterisks. Scale bars, 50 nm.

