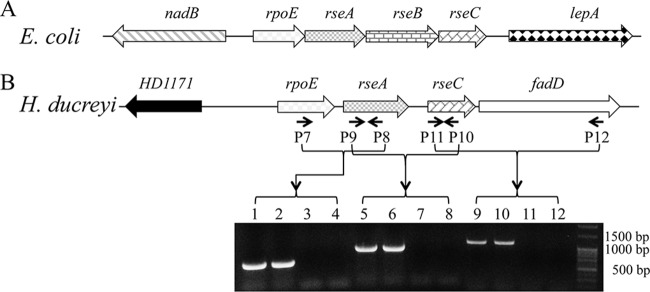
FIG 1.

The rpoE loci in E. coli and H. ducreyi. (A) Genomic organization of the rpoE locus in E. coli K-12. (B) Genomic organization and RT-PCR analysis of the rpoE locus in H. ducreyi. Arrows indicate the binding sites for primers used for RT-PCR analysis. Lanes 1, 2, 3, and 4, RT-PCR with primers P7 and P8; lanes 5, 6, 7, and 8, RT-PCR with primers P9 and P10; lanes 9, 10, 11, and 12, RT-PCR with primers P11 and P12. Lanes 1, 5, and 9, positive control using genomic DNA; lanes 2, 6, and 10, RT-PCR; lanes 3, 7, and 11, control without reverse transcriptase; lanes 4, 8, and 12, control without template. The RT-PCR data are representative of cDNA made from three independent RNA samples.
