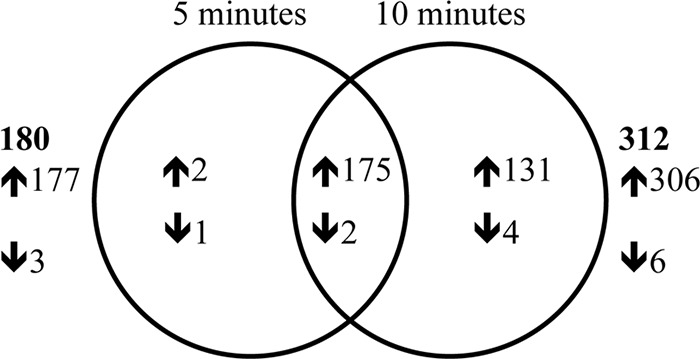
FIG 3.

Venn diagram showing the overlap in genes differentially expressed at 5 and 10 min after induction of RpoE expression. The up- and downregulated genes are indicated by ↑ and ↓, respectively. The total number of differentially expressed genes at each time point is indicated in bold. 5 min and 10 min, genes differentially expressed in 35000HP(pDG9) relative to 35000HP(pDG10) at 5 and 10 min after RpoE induction, respectively.
