
FIG 1.
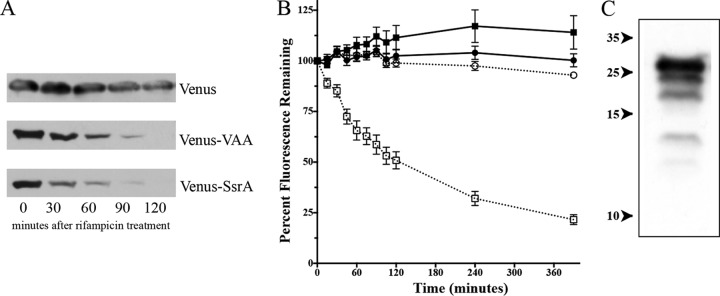
Venus and Venus-VAA protein levels in S. aureus SH1000 wild-type cells following rifampin treatment. (A) Western blot analysis of lysates of wild-type SH1000 with either pALC6954 (producing Venus), pALC6955 (producing Venus-VAA), or pALC7901 (producing Venus-SsrA) grown to an OD650 of 1.1 after rifampin treatment (200 μg/ml). The blot was probed with an anti-GFP primary antibody and then a secondary horseradish peroxidase-conjugated goat anti-mouse antibody. The experiments were repeated three times, and a representative blot of each set of lysates is displayed. (B) Venus fluorescence emitted from strains ALC6954 (producing Venus; circles) and ALC6955 (producing Venus-VAA; squares) either stalled by 50 μg/ml erythromycin after reaching an OD650 of 1.1 (open symbols) or not treated with drug (closed symbols). The fluorescence at 540 nm was observed following excitation at 515 nm and normalized to the cell density at the OD650. Values were then compared to the fluorescence at time zero. The result for each time point is the mean and standard deviation of three biological replicates. (C) Degradative laddering of Venus-VAA. The lysate from wild-type SH1000 expressing Venus-VAA from pALC6955 was resolved and immunoblotted with an anti-GFP primary antibody and a secondary horseradish peroxidase-conjugated goat anti-mouse antibody. Exposure to film was extended to reveal lower-molecular-mass bands. Numbers on the left are molecular masses (in kilodaltons).