
FIG 5.
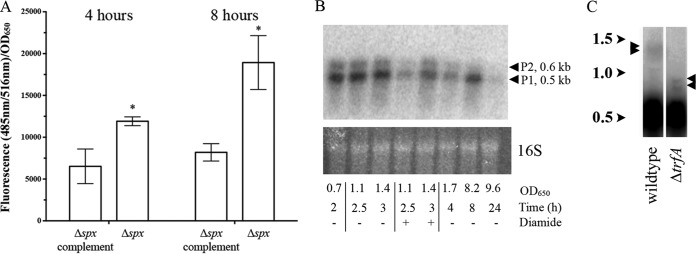
spx regulation of trfA and spx transcription. (A) GFP fluorescence driven by the spx P1 promoter on a shuttle plasmid containing a GFP reporter (pALC7803) in the Δspx and spx-complemented strains at the 4- and 8-h time points (late log and early stationary phases, respectively). To minimize variations in fluorescence attributable to cell density, the data are presented as the average number of fluorescence units for triplicate samples per unit of absorbance at 650 nm. *, a statistically significant difference (P <0.05) compared to the results for spx-complemented strain, as measured by Student's unpaired t test. (B) Northern blot of spx transcription from S. aureus SH1000 at various growth phases with and without 5 mM diamide. RNA (20 μg each) was resolved on a denaturing agarose gel, blotted as described above, and probed with a 300-bp 32P-radiolabeled spx DNA probe. As a loading control, ethidium bromide-stained 16S rRNA was included, and the results are shown at the bottom. Arrowheads, sizes of the transcripts generated from the P1 and P2 spx promoters. (C) Northern blots of RNA extracted from the S. aureus SH1000 and ΔtrfA strains at the late exponential phase of growth (OD650 = 1.1) and probed with a 300-bp 32P-radiolabeled spx probe. Faint bands are identified by arrowheads to the side of each lane. The numbers to the left indicate kilobases.