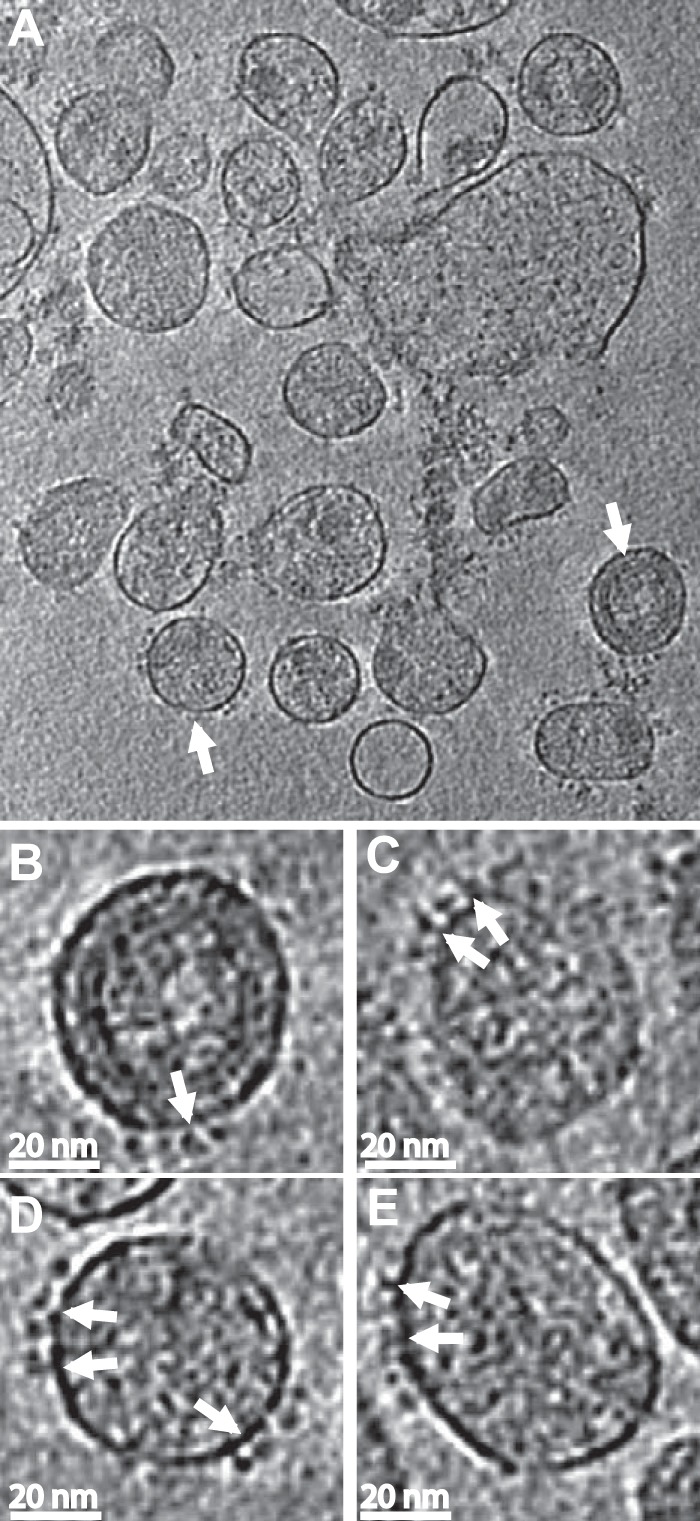
FIG 2.

Images of antibody labeled HIV-1 MN virions. (A) A slice through the x-y plane of one of the HIV-1 MN cryo-electron tomograms. The spikes are significantly fewer compared to the short-tailed SIV (it has more spikes on its membrane surface due to truncation of the cytoplasmic tail) but still visible on the viral surface. Parts of the cores within some of the virions are also visible but the AZT treatment significantly disrupts the core of the virion. Scale bar, 100 nm. (B to E) Representative slices through individual virions following binning. The density range displayed is the mean ± 3σ. Binning (averaging the densities of a 2×2×2 cube into a single voxel) enhances the signal-to-noise ratio, thereby improving the visibility of the spikes and bound antibody. The tomograms were then reinterpolated back to the original voxel size to reduce pixelation. Panels B and D come from virions marked with white arrows in the lower-magnification view shown in panel A. The binding can be seen clearly in some of the spikes (white arrows) on the viral membrane. Antibodies sometimes extend up relative to the membrane plane and sometimes parallel to the membrane plane.
