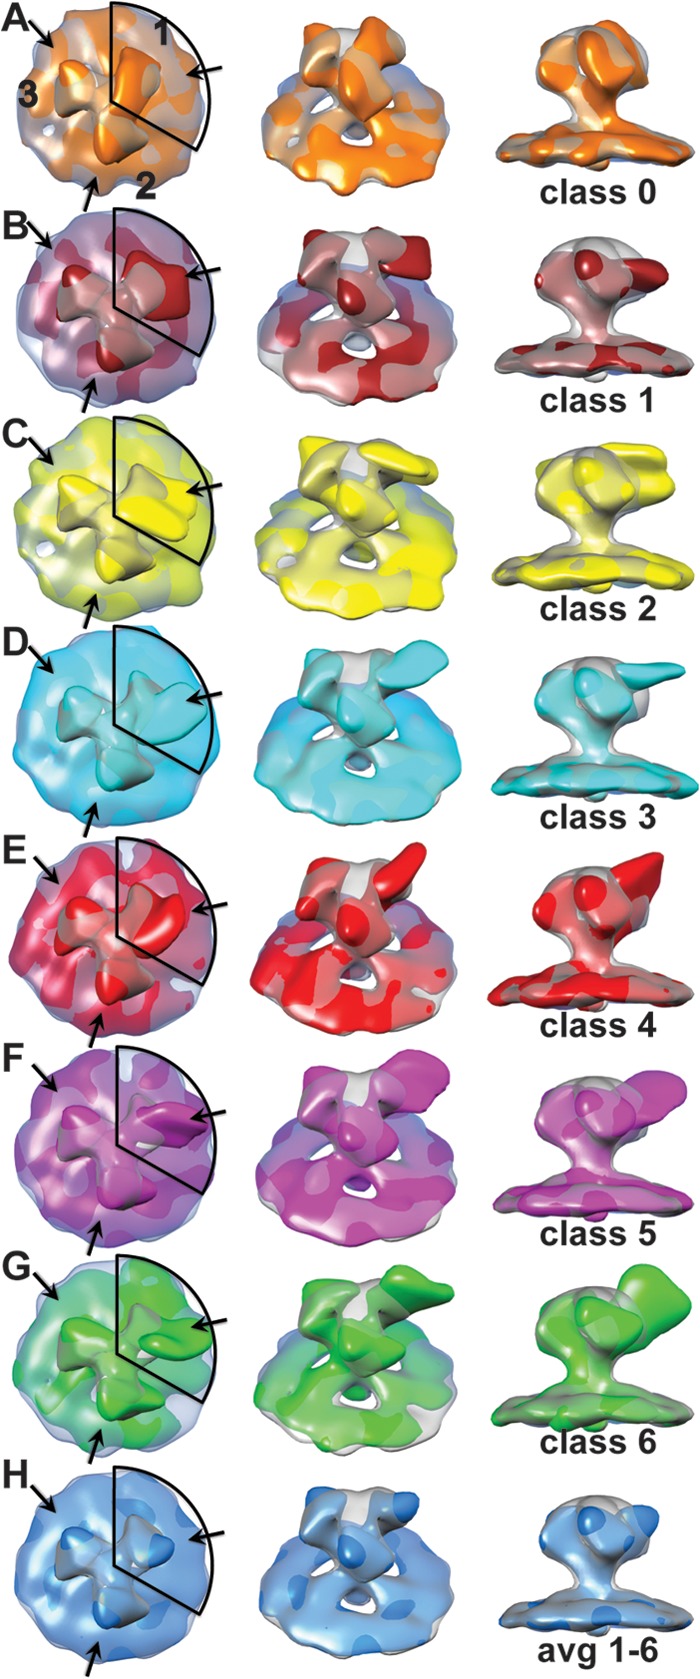
FIG 3.

Density maps from the one-arm classification of HIV-1 MN Env spike with bound 447-52D antibody. In the left-hand column is a view down the 3-fold axis of the spike. The numbers in the top row of column A label the spike arms, thereby defining each arm as to whether classification was carried out, arm 1, or not, arms 2 and 3. The central column is a view obtained by rotating the spike average by 45° about the horizontal axis and away from the observer. The right-hand column is a view tangential to the membrane plane. Each map is superimposed on the symmetrized average of the unliganded control spike arm at 50% transparency. The contour threshold used for the unliganded control spike is the same for all figures that show it. (A) The class average having the least density due to bound MAb, which was used for making the symmetrized control spike. (B to G) The six class averages showing density due to bound antibody. (H) Average of classes 1 to 6 weighted according to the number of class members. The coloring scheme is as follows: class 0, orange; class 1, brick; class 2, yellow; class 3, cyan; class 4, red; class 5 magenta; class 6, green; and the average of 1 to 6, dodger blue. These images can also be seen as an aligned, animated, and annotated sequence in Movie S2 in the supplemental material.
