
FIG 7.
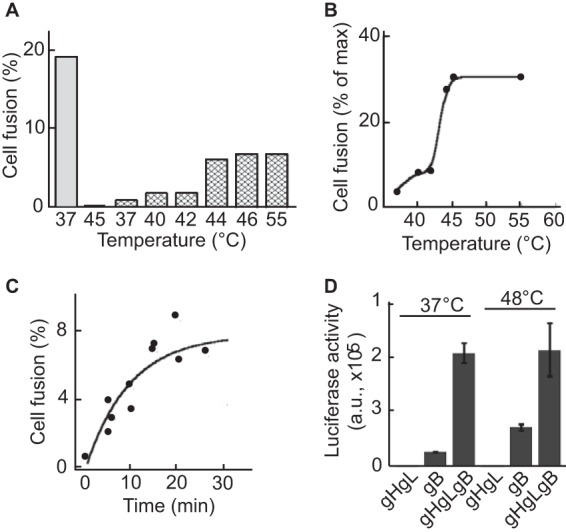
Increase of temperature triggers fusion of AGS cells expressing gB. (A) AGS cells were transfected with plasmids expressing gB, gH, and gL (gray bar), gH and gL alone (second bar from the left), or gB alone (hatched bars). Twenty-four h later, cells were incubated at the indicated temperature for 20 min, cooled, and returned to 37°C. After a further 16 h, cells were fixed and stained with monoclonal antibody CL55 to gB and FITC-conjugated goat anti-mouse antibody. Fusion was calculated as the percentage of stained cells containing 4 or more nuclei. (B) Graphical representation of data shown in panel A, where the maximum fusion (max) is that seen in cells transfected with plasmids expressing gB, gH, and gL and maintained at 37°C. (C) Kinetics of fusion achieved by exposing cells to 45°C for different times as indicated. (D) CHO cells were transfected with plasmids expressing gH and gL, gB alone, or gB, gH, and gL as indicated together with a plasmid expressing luciferase under the control of the T7 promoter. Twenty-four h later, cells were trypsinized and mixed with an equal number of 293T14 cells for 150 min. Cells then either were maintained at 37°C or warmed to 48°C for 20 min before the addition of cool medium and a return to 37°C. Twenty-four h later, cells were lysed and luciferase activity was measured in a luminometer. Error bars represent the standard deviations from 4 replicates, and the experiment is representative of three independent experiments. a.u., arbitrary units.