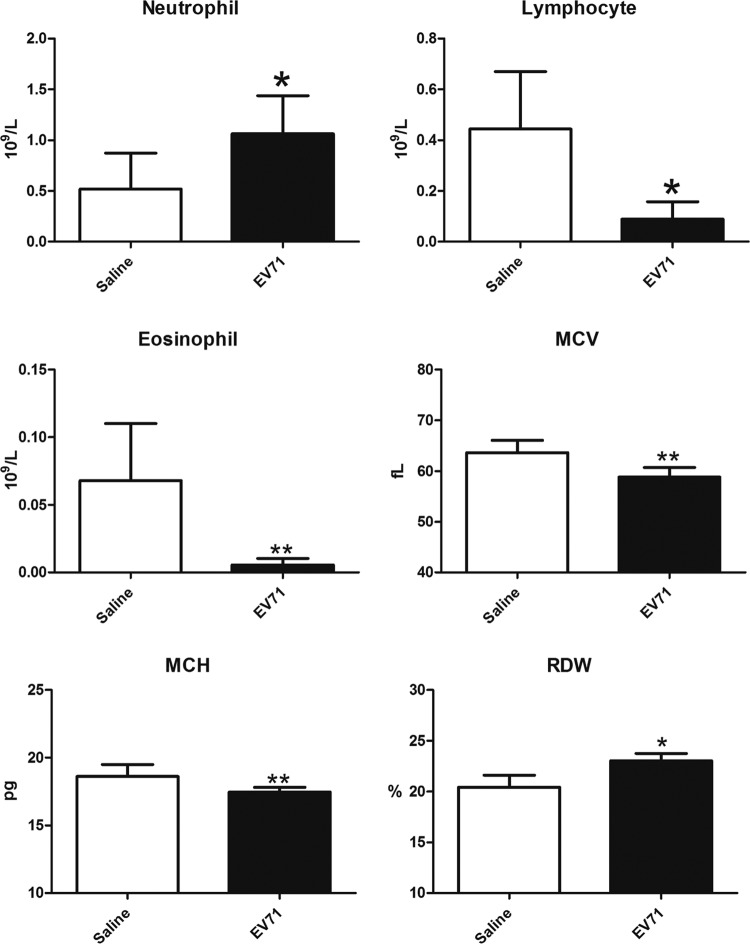
FIG 4.
Hematological changes in NOD/SCID mice infected i.p. with EV71 (108 PFU) or injected with normal saline. Blood was collected on day 11 postinfection. Complete blood counts were recorded by an Abbott Cell-Dyn 3700 system. MCV, mean cell volume; MCH, mean cell hemoglobin; RDW, red blood cell volume distribution width. Values are means ± standard deviations for 6 mice in each group. Asterisks indicate significant differences (*, P < 0.05; **, P < 0.01) from the saline control by Student's t test.

