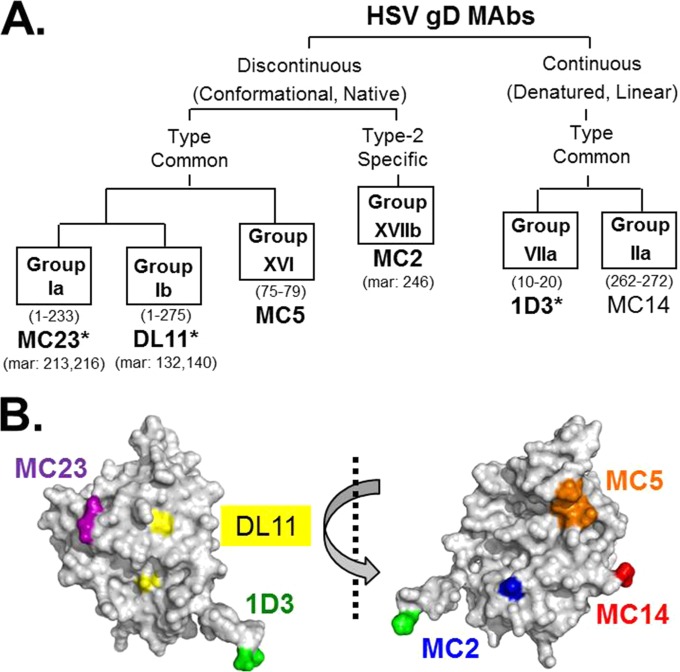
FIG 3.
HSV gD MAb tree. (A) Diagram showing gD antigenic sites and associated MAbs used in this study. The defining properties of MAbs within each branch of the tree are indicated. Antigenic sites are defined by “groups” of MAbs that compete with each other for gD binding. MAb group designations are shown in boxes. gD residues implicated in MAb binding are in parentheses below group names. Representative MAbs are shown in large font below group names, with known residues of mar (MAb-resistant) mutants indicated below. Virus-neutralizing MAbs are shown in bold type. Receptor-blocking MAbs are indicated by an asterisk. (B) Two views of the gD structure rotated 180 degrees. The locations of the epitopes of MAbs listed above are indicated.

