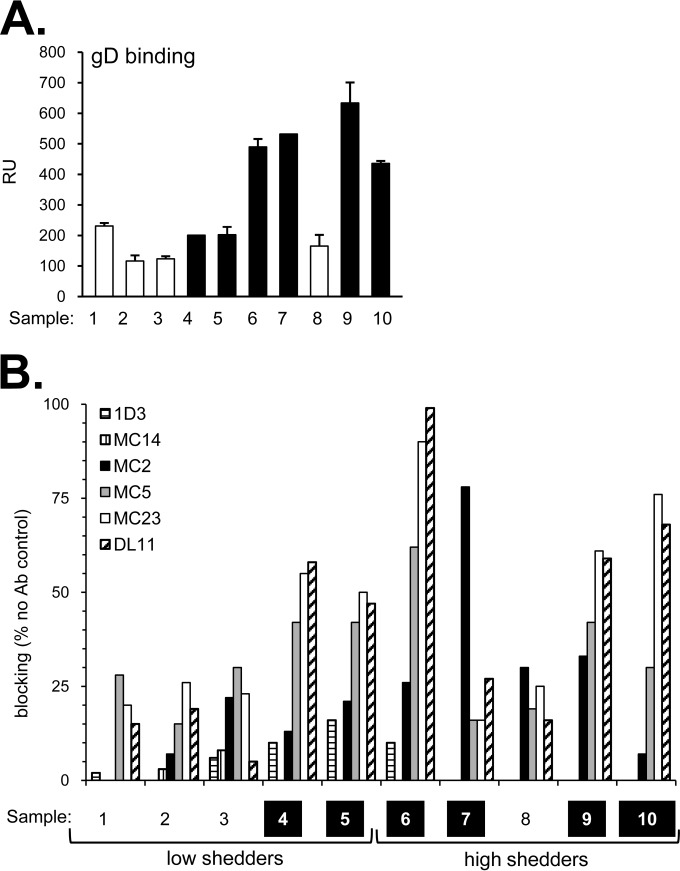
FIG 4.
(A) Binding of subject IgG to gD2 via biosensor. A fixed amount of each IgG was injected across a chip surface coated with purified protein. The levels of IgG binding (response units [RU]) for human sample IgG are shown. The samples with the strongest HSV-2 neutralization activity are represented by black bars and the weaker neutralizers by white bars. Error bars indicate standard errors for at least two experiments. (B) Biosensor analysis: blocking of neutralizing gD MAbs via human subject IgG. Each bar indicates the percent blocking activity (compared to the no-antibody control) against the anti-gD MAbs tested (1D3, MC14, MC2, MC5, MC23, DL11). Samples classified as strong HSV-2 neutralizers are highlighted in black along the bottom row. A representative experiment is shown.

