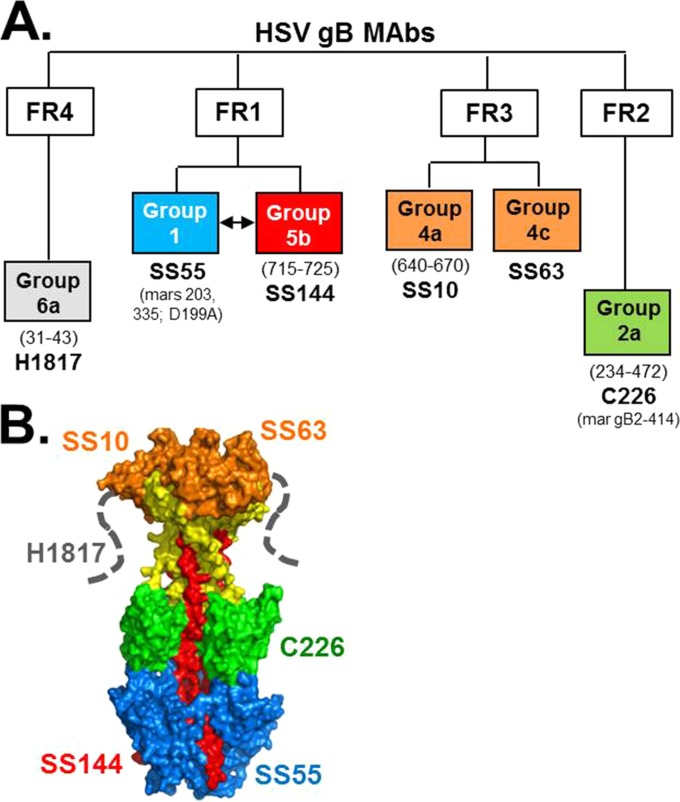
FIG 5.
HSV gB MAb tree. (A) Diagram showing gB antigenic sites and associated MAbs used in this study. Antigenic sites are defined first within gB functional regions (FR) as defined by Bender et al. (8) and secondly by “groups” of MAbs that compete with each other for gB binding. MAb group designations are shown in boxes, color-coded to their epitope binding region as shown on the gB crystal structure in panel B. gB residues implicated in MAb binding are in parentheses below group names. Representative MAbs are shown in large font below group names, with known residues of mar mutants indicated below.

