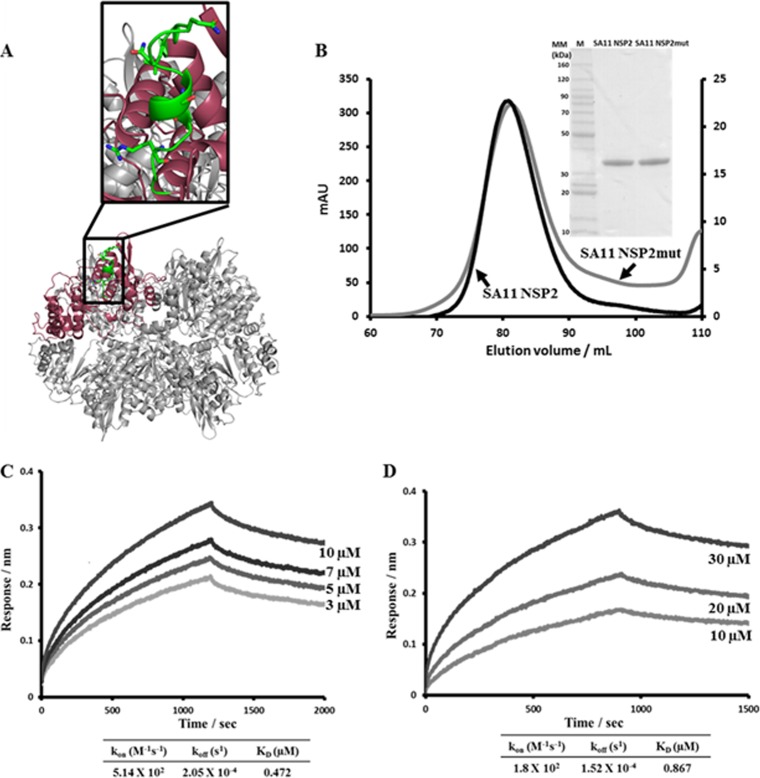
FIG 10.
BLI analysis of SA11 NSP2mut-VP1 and NSP2mut-NSP6 interactions. (A) Ribbon diagram of the NSP2 octamer (gray) with the peptide LKVTQANVSNVLSRVVS (aa 91 to 107) chosen for the site-directed mutagenesis experiments shown in green on one of the subunits (pink) in the octamer. Amino acids 91, 95, 97, 100, and 104 (shown as sticks) were mutated to alanine, and the resulting NSP2mut was tested for binding to VP1 and NSP6 by BLI. (B) Gel filtration profiles of the SA11 strain wild-type NSP2 and NSP2mut. (Insert) Coomassie blue-stained SDS-PAGE gels of the wild-type SA11 NSP2 and SA11 NSP2mut proteins. (C) NSP2mut-VP1 association and dissociation curves were obtained through serial dilutions of NSP2mut (0.8, 1.5, 3, 5, 7, and 10 μM). Representative sensograms for four of the concentrations are shown. (D) NSP2mut-NSP6 association and dissociation curves were obtained through serial dilutions of NSP2mut (1.25, 2.5, 5, 10, 20, and 30 μM). Representative sensograms for three of the concentrations are shown. Sensograms were fitted with global one-site binding model. The KD, kon, and koff values for the sites are shown.

