FIG 11.
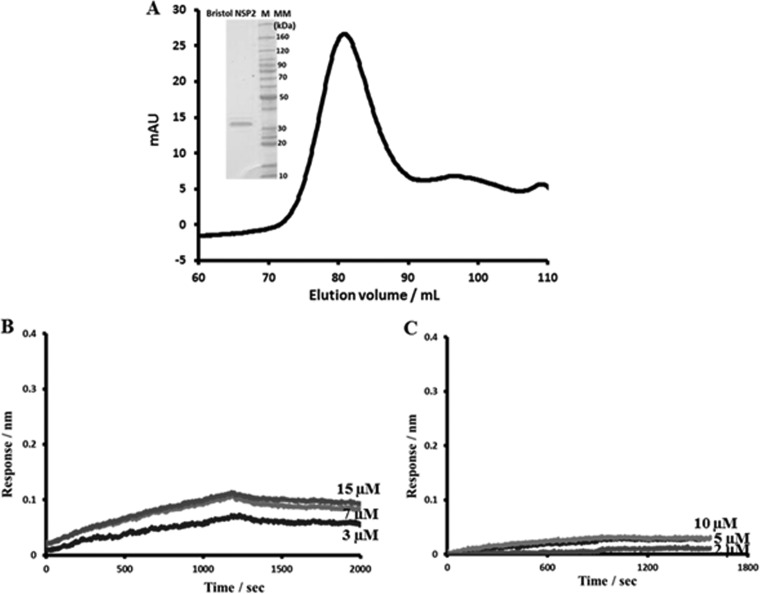
BLI analysis of the Bristol NSP2-SA11 VP1 and Bristol NSP2-SA11 NSP6 interactions. (A) Gel filtration profile of the Bristol strain NSP2. (Insert) Coomassie blue-stained SDS-PAGE gel of the Bristol NSP2 protein. (B) BLI analysis of the Bristol NSP2-SA11 VP1 interaction. Association and dissociation curves were obtained through serial dilutions of Bristol NSP2 (0.5, 0.8, 1.5, 3, 5, 7, and 10 μM). Representative sensograms for three of the concentrations are shown. (C) BLI analysis of the Bristol NSP2-SA11 NSP6 interaction. Association and dissociation curves were obtained through serial dilutions of Bristol NSP2 (1.25, 2.5, 5, 10, and 20 μM). Representative sensograms for three of the concentrations are shown. In contrast to SA11 NSP2, only minimal signals, comparable to those of the negative control, were detected, indicating no binding between the proteins.

