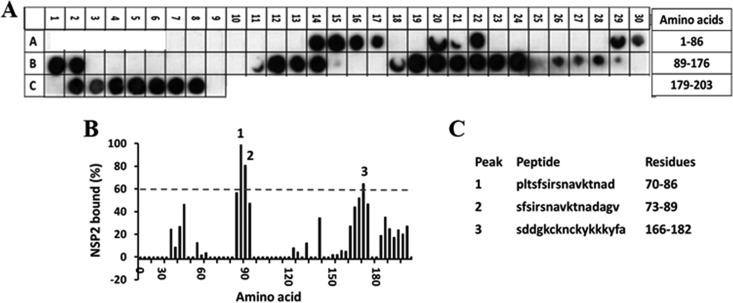
FIG 2.
Binding of the full-length SA11 NSP2 to the peptide array of the SA11 NSP5 sequence. (A) Autoradiograph of the NSP5 peptide array probed with full-length NSP2. The peptide array consists of spots of 17-residue peptides in the protein sequence, starting from the N terminus (spot A7, upper left corner of the array) and ending with the C-terminal peptide (spot C9, lower right corner of the array), with the N-terminal residue of the peptide in each spot shifted by 3 residues from the previous spot along the protein sequence. Dark spots on the autoradiograms indicate peptides with high binding specificities, whereas the light spots indicate peptides with weak or no binding. (B) Graph showing relative intensity (y axis) of each spot (black bars) in the array with its position relative to the protein sequence (x axis). The tick marks on the x axis correspond to spots A7 through C8. In this graph, the spot intensities, after subtracting the background (a negative control), were plotted relative to the spot with the highest intensity, which was set as 100% binding. Spots that show intensities higher than the 60% cutoff are numbered. (C) The peptide sequences corresponding to the three spots (1 to 3) in panel B.

