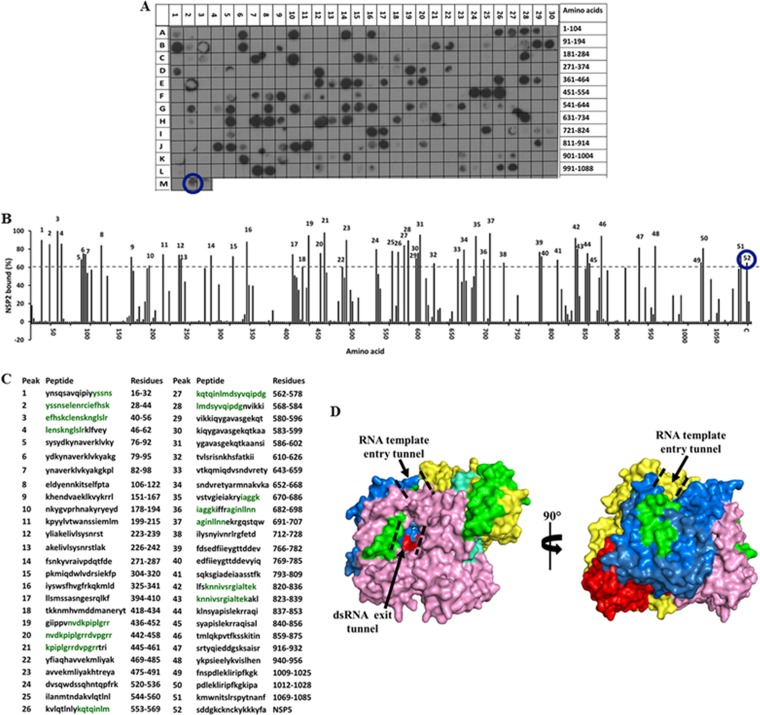
FIG 3.
Binding of the full-length SA11 NSP2 to the peptide array of the SA11 VP1 sequence. (A) Autoradiograph of the VP1 peptide array probed by full-length NSP2. The peptide array consists of spots of 17-residue peptides in the VP1 sequence starting from the N terminus (spot A1) and ending with the C-terminal peptide (spot L27), with the N-terminal residue of the peptide in each spot shifted by 3 residues from the previous spot along the VP1 sequence. (B) Graph showing the relative intensity (y axis) of each spot (black bars) in the array with its position relative to the protein sequence (x axis). The spot with the highest intensity was set as 100% binding. The spots with intensities higher than the 60% cutoff are numbered 1 to 52. (C) The peptide sequences corresponding to the peaks (1 to 52) in panel B. VP1 residues present in at least two spots that showed ≥80% binding intensity (green) were mapped onto the crystal structure of VP1 (pdb 2R7R). (D) Surface representation of the VP1 structure with the N-terminal domain (yellow), C-terminal domain (pink), and the polymerase fingers (blue), palm (red), and thumb (cyan) subdomains labeled. NSP2-binding regions are shown in green. The RNA template entry tunnel and dsRNA exit tunnel are shown by dashed black lines. In panels A and B, the NSP5 peptide is marked by a blue circle.

