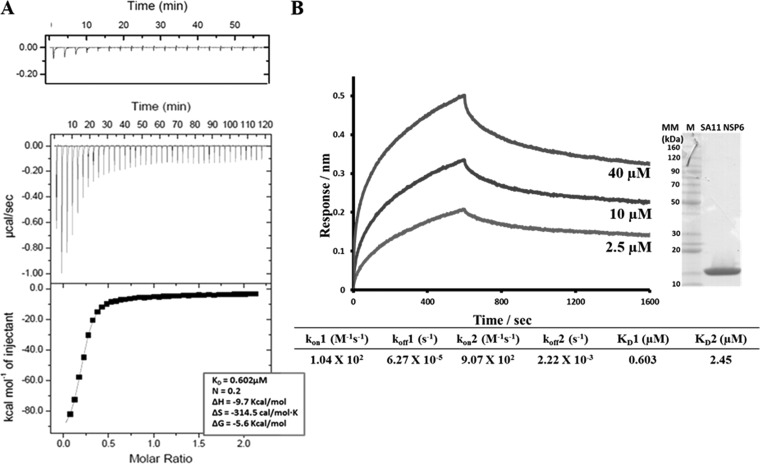
FIG 8.
ITC and BLI analyses of NSP2-NSP6 interactions. (A) ITC measurement of NSP2 binding to NSP6. The middle graph shows the original raw data, and the fit after integration is shown in the bottom graph (KD = 0.602 μM). The control titration is shown on top. (B) BLI measurement of NSP2 binding to NSP6. NSP2-NSP6 association and dissociation curves were obtained through serial dilutions of NSP2 (2.5, 5, 10, 20, and 40 μM). Representative sensograms for three of the concentrations are shown. Sensograms were fitted with a global two-site binding model. The KD1, KD2, kon, and koff values for two sites are shown. The insert shows the Coomassie blue-stained SDS-PAGE gel of the SA11 NSP6 protein.

