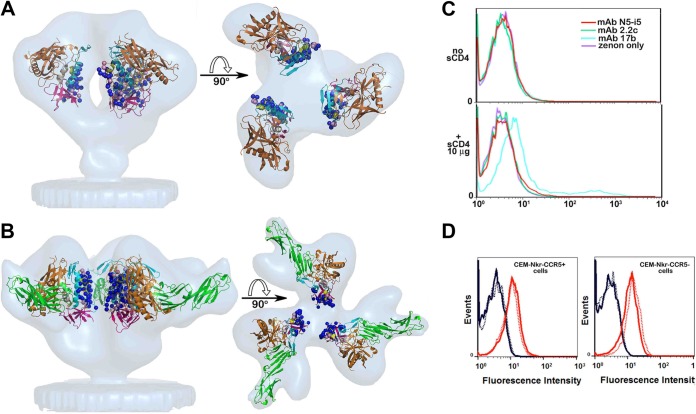
FIG 5.
Exposure of N5-i5 and 2.2c epitopes on a viral trimer. (A) Colocalization of N5-i5 and 2.2c epitopes within the virion-associated untriggered HIV-1 trimers. The Cα atoms of gp120 residues involved in interaction with N5-i5 (blue balls) and 2.2c (pink balls) are mapped into the trimer structure derived by cryo-electron tomography (53) and are shown as blue and pink balls, respectively. gp120 molecules are shown as ribbon diagrams and colored as in Fig. 3. The views of trimers are from the side, with the viral membrane oriented toward the bottom (left) and rotated 90° about a horizontal axis with the viral membrane at the bottom (right). (B) Colocalization of N5-i5 and 2.2c epitopes within HIV-1 trimers triggered with the soluble CD4. N5-i5 and 2.2c epitope footprints were mapped in the structure derived by cryo-electron tomography of the gp120Bal-d1d2CD4 trimer (67). The mapping of N5-i5 and 2.2c epitope footprints in the tomograms confirms that they stay largely within the interface of d1d2CD4-triggered spike and are not available for antibody recognition, due to steric hindrance. See also Fig. S4 in the supplemental material. (C) The binding curves of MAb N5-i5 (red line) and 2.2c (green line) to surface-expressed HIV-1BaL trimers in the presence or absence of soluble d1-d4CD4 (sCD4). Experiments were performed as described in Materials and Methods. CD4i antibody 17b (cyan line) was used as a positive control. The enhancement of binding to sCD4-triggered HIV-1BaL trimers was observed only for coreceptor binding site MAb 17b. (D) MAb N5-i5 binding (solid lines) and 2.2c binding (dashed lines) to CEM-Nkr-CCR5+ cells (left) or CEM-Nkr-CCR5− cells (right). The rightmost curves (red) in each histogram overlay represent the binding of N5-i5 or 2.2c to virion-sensitized cells, whereas the leftmost curves (blue) represent the binding of these MAbs on cells not sensitized with virions.

