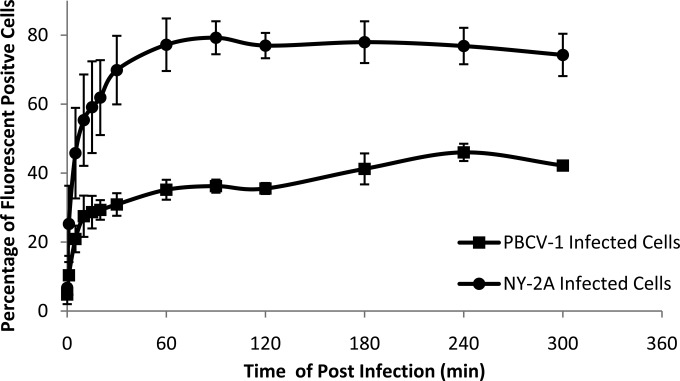
FIG 6.
Measurement of superoxide levels in PBCV-1- and NY-2A virus-infected C. variabilis cells. C. variabilis cells (4 × 10⁸/ml) were mixed with 1 μl of 5 mM DHE to a final concentration of 5 μM and incubated for 1 h by rolling to let the dye penetrate the cells. (DHE forms a red fluorescent product when it reacts with superoxide anions.) The cells were then infected with either PBCV-1 or NY-2A at an MOI of 10 and analyzed by flow cytometry. cvSOD is encoded by PBCV-1 and packaged in its capsid, while NY-2A does not encode a cvSOD.

