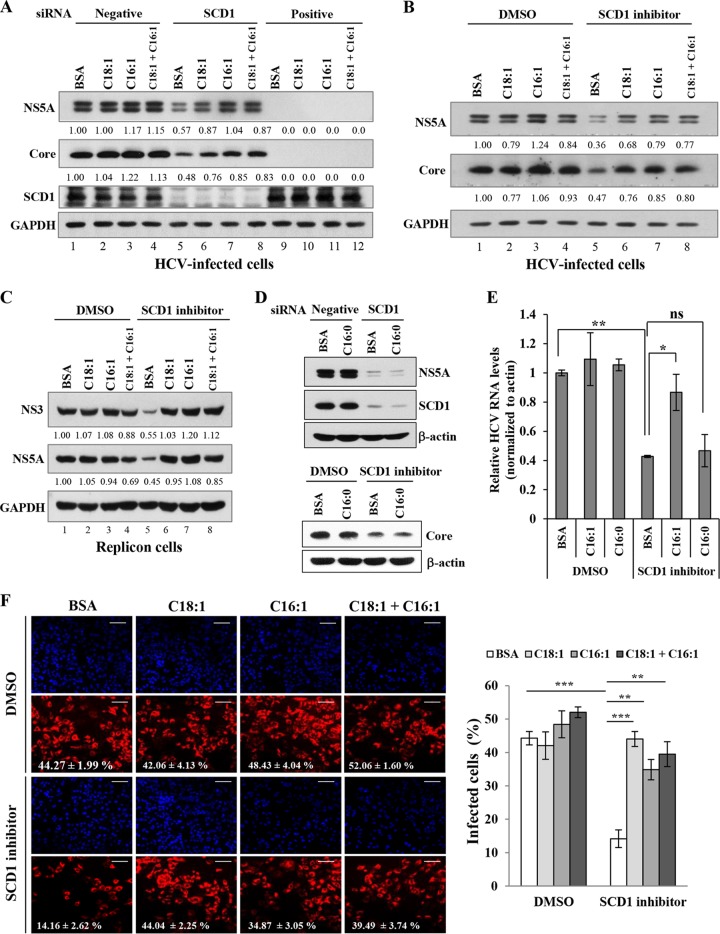
FIG 3.
SCD1 enzymatic products resurrect HCV replication in SCD1-enervated cells. (A) Huh7.5 cells were transfected with the indicated siRNAs. At 4 h after transfection, BSA, oleic acid, and palmitoleic acid, respectively, or a combination of oleic and palmitoleic acids was supplemented at a final concentration of 50 μM. At 2 days after siRNA transfection, cells were washed twice with PBS and infected with Jc1 for 4 h. Following incubation with the same supplement for 48 h, total cell lysates were immunoblotted with the indicated antibodies. (B) Huh7.5 cells infected with Jc1 were incubated with either DMSO or SCD1 inhibitor (1 μM) containing the same supplement as described above. At 2 days postinfection, total cell lysates were immunoblotted with the indicated antibodies. (C) Huh6 cells harboring HCV subgenomic replicon were either left untreated (DMSO control) or treated with SCD1 inhibitor (1 μM) in the presence of either oleic acid or palmitoleic acid alone or both acids as indicated. At 72 h after treatment, total cell lysates were immunoblotted with the indicated antibodies. Protein band intensities of HCV proteins/GAPDH were analyzed by ImageJ. (D) (Top panel) Huh7.5 cells were transfected with the indicated siRNAs. At 4 h after transfection, BSA or palmitic acid, respectively, was supplemented at a final concentration of 50 μM. At 2 days after siRNA transfection, cells were infected with Jc1 for 4 h. At 2 days postinfection, total cell lysates were immunoblotted with the indicated antibodies. (Bottom panel) Huh7.5 cells were infected with Jc1 for 4 h and then incubated with either DMSO or SCD1 inhibitor (1 μM) containing the same supplement as described in the left panel. At 2 days postinfection, total cell lysates were immunoblotted with the indicated antibodies. (E) Huh7.5 cells infected with Jc1 were incubated with either DMSO or SCD1 inhibitor (1 μM) containing BSA, palmitoleic acid, and palmitic acid, respectively, at a final concentration of 50 μM. At 2 days postinfection, HCV RNA levels were quantified by qPCR. Data represent averages from at least three independent experiments. The asterisks indicate significant differences (*, P < 0.05; **, P < 0.01) from the value for the DMSO control and from the value for the BSA control. ns, not significant compared to the value for the BSA control. (F) (Left) Huh7.5 cells plated on glass slides were infected with Jc1 for 4 h and then treated with either DMSO or SCD1 inhibitor (1 μM) containing the same supplement as described for panel A. Following incubation with the same supplement for 48 h, cells were stained for indirect immunofluorescence assay. Bars, 100 μm. (Right) The percentage of infected cells (NS5A-positive red cells) per total cells (DAPI) was determined from 15 randomly picked microscope fields by ImageJ. Data represent averages from 15 microscope fields for each. The asterisks indicate significant differences (**, P < 0.01; ***, P < 0.001).

