
FIG 2.
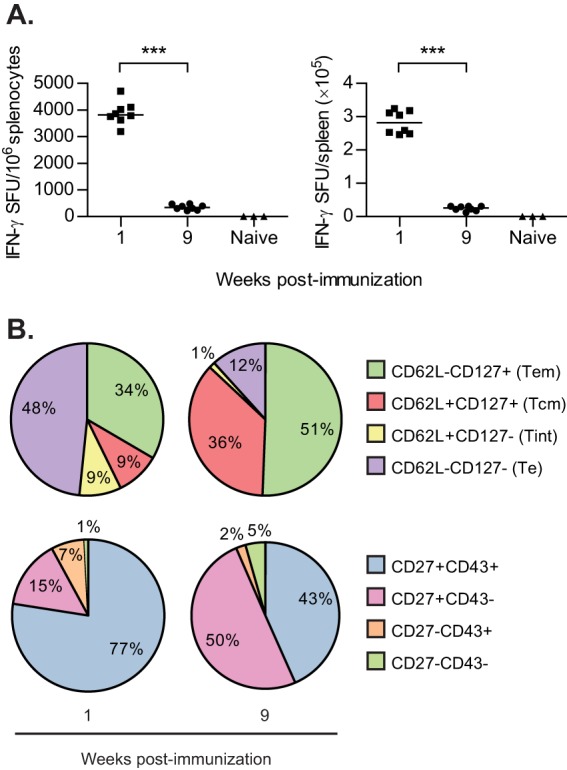
Characterization of CD8+ T cell response after one immunization. C57BL/6 mice were immunized once with 106 IU VREP-OVA. Each immunized group consisted of eight mice, and the naive group consisted of three mice. Mice were sacrificed, and spleens were collected 1 and 9 weeks after immunization. (A) SIINFEKL-specific CD8+ T cell responses were assessed by IFN-γ ELISPOT. Lines represent medians. ***, P < 0.001. (B) Pie charts show the proportions of antigen-specific CD8+ T cells expressing CD62L/CD127 (top) or CD27/CD43 (bottom) assessed by pentamer and surface marker staining and flow cytometry analysis.