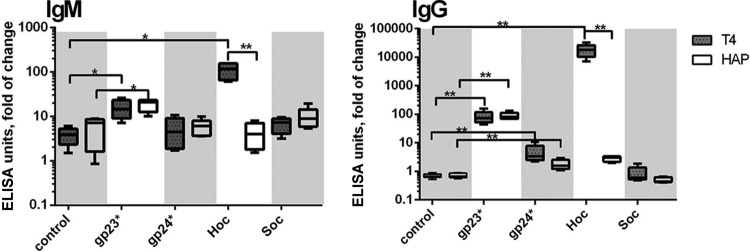
FIG 2.

Humoral response to individual T4 head proteins in animal model. Mice (n = 8) were injected i.p. with T4 phage or HAP1 phage (for dose schema, see Materials and Methods). Control mice were injected with PBS. Antibody levels were tested in murine sera on day 5 (IgM) or day 40 (IgG) by ELISA with a high-titer standard serum as a reference, and ELISA units were calculated. Fold increase in comparison to the control is presented. Whiskers represent minimal and maximum values, boxes represent SD, and medians are marked by bars. Results are presented in logarithmic scale. **, difference statistically significant (P < 0.001; Kruskal-Wallis ANOVA); *, difference statistically significant (P < 0.02; Kruskal-Wallis ANOVA).
