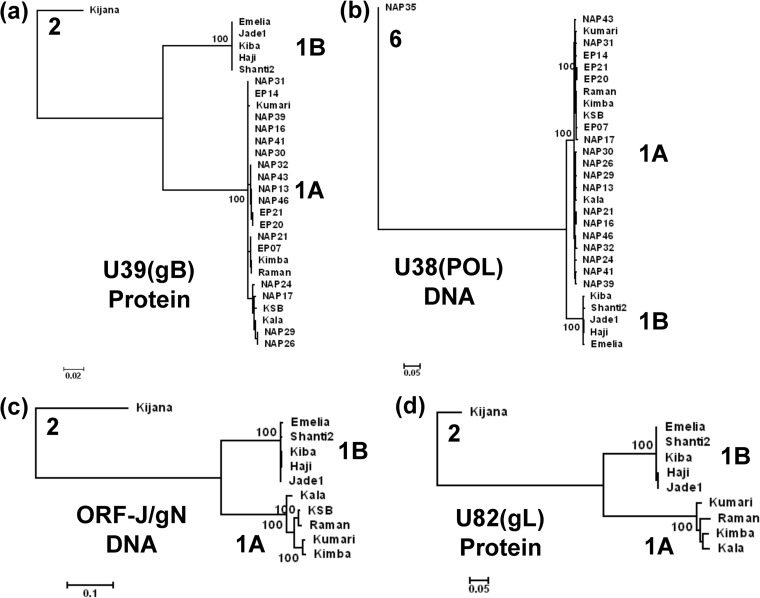
FIG 2.
Linear phylogenetic trees illustrating the EEHV1A versus EEHV1B diaspora among multiple strains within the major chimeric domains. Maximum likelihood phylogenetic dendrograms for two sets of proteins and two DNA loci derived from multiple independent EEHV1 strains. The diagrams include equivalent data from the orthologous prototype genes of either EEHV2 or EEHV6 as outgroups. (a) Set of 28 examples of the EEHV1 U39(gB) protein mapping within CD-I (EEHV1A [1A] [851 aa], EEHV1B [1B] [847 aa], and EEHV2 [2] [851 aa]). (b) Set of 28 examples of the EEHV1 U38(POL) gene DNA locus mapping within CD-I (1A [2,319 bp], 1B [2,304 bp], and 2 [2,316 bp]). (c) Set of 10 examples of the combined EEHV1 U45.7(ORF-J) plus U46(ORF-N) gene DNA locus mapping within CD-II (1A [753 bp], 1B [700 bp], and 2 [780 bp]). (d) Set of 9 examples of the EEHV1 U82(ORF-L) protein mapping within CD-III (1A [263 aa], 1B [265 aa], and 2 [266 aa]). After gaps were omitted, the final data sets totalled 843 aa in panel a, 2301 bp in panel b, 666 bp in panel c, and 261 aa in panel d. PCR data given here for ORF-J/gN of EEHV1A(NAP23, Kimba) and for gL of EEHV1B(EP18, Emelia) match those from their complete genomes (GenBank accession nos. KC618527 and KC462164). Data for EEHV1A(Raman) derived from GenBank accession no. KC462165 was included in all four panels for comparison. Bootstrap values (100 replicates), distance scales (number of substitutions per site).

