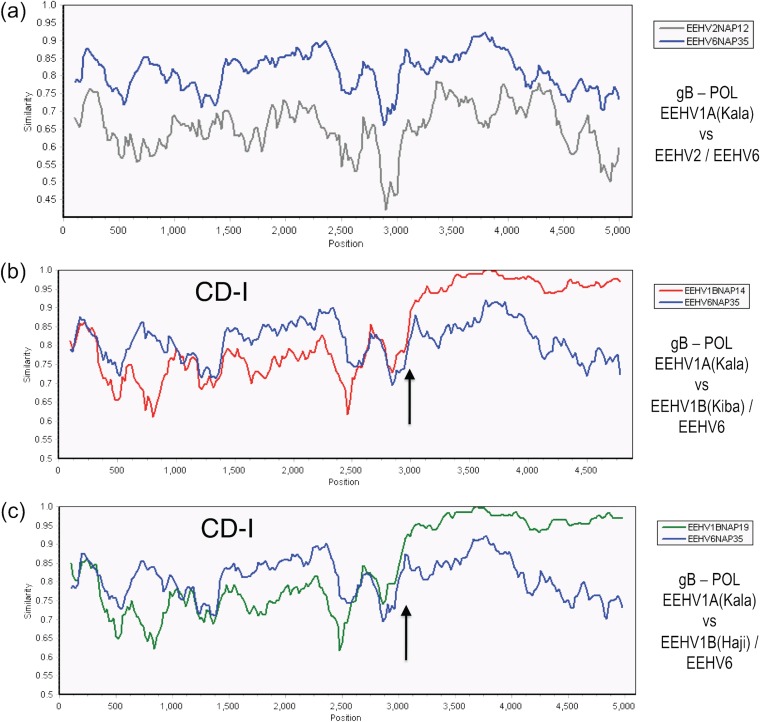
FIG 3.
Evaluation of EEHV1A-1B chimeric domain CD-I patterns and boundaries relative to EEHV6. The diagrams show SimPlot comparisons of the nucleotide identity patterns between EEHV6, EEHV1A, EEHV1B, and EEHV2 across the 3.0-kb EEHV1B chimeric domain CD-I. (a) CD-I. The 5,000-bp U39(gB)-U38(POL) segment from EEHV1A(Kala, NAP18) map coordinates 73,959 to 79,043 compared to EEHV6(NAP35) (blue) and to EEHV2(Kijana, NAP12) (gray) is shown. (b) CD-I. The 4,800-bp U39(gB)-U38(POL) segment from EEHV1A(Kala, NAP18) map coordinates 73,987 to 78,860 compared to EEHV1B(Kiba, NAP14) (red) and to EEHV6(NAP35) (blue) is shown. (c) CD-I. The 5,000-bp U39(gB)-U38(POL) segment from EEHV1A(Kala, NAP18) map coordinates 73,959 to 79,043 compared to EEHV1B(Haji, NAP19) (green) and to EEHV6(NAP35) (blue) is shown. Arrows mark the positions of the chimeric domain boundary transitions, and the relevant DNA accession numbers are included in Table S1 in the supplemental material.

