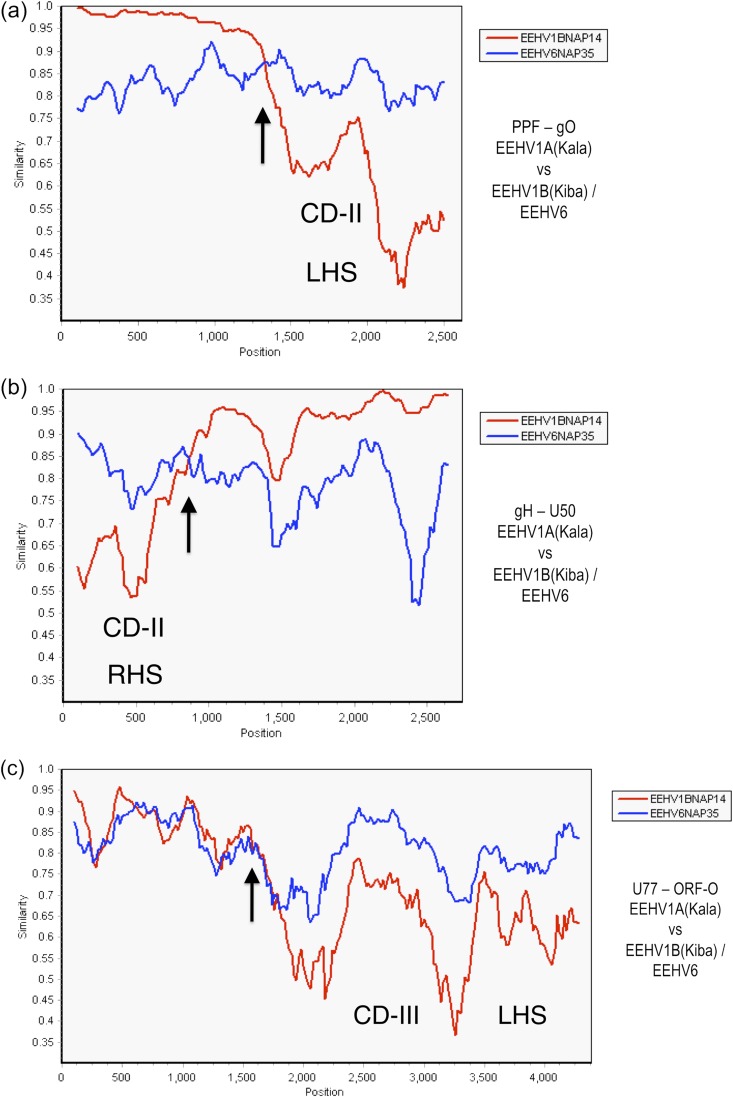
FIG 4.
Evaluation of EEHV1A-1B chimeric domain CD-II and CD-III patterns and boundaries relative to EEHV6. The diagrams show SimPlot comparisons of the nucleotide similarity patterns between EEHV6, EEHV1A, and EEHV1B across both the left-hand side (LHS) and right-hand side (RHS) boundaries of the 3.7-kb CD-II region and across the LHS boundary only of the 8.3-kb CD-III region of EEHV1B. (a) CD-II LHS. The left-hand side of the 2.6-kb U27(PPF)-U47(gO) segment across map coordinates 101,128 to 103,703 for EEHV1A(Kala, NAP18) compared to EEHV1B(Kiba, NAP14) (red) and to EEHV6(NAP35) (blue). (b) CD-II RHS. The right-hand side of the 2.7-kb U48(gH)-U50(PAC2) segment across map coordinates 105,364 to 108,084 for EEHV1A(Kala, NAP18) compared to EEHV1B(Kiba, NAP14) (red) and to EEHV6(NAP35) (blue) is shown. (c) CD-III LHS. The left-hand side of the 4.3-kb U77-U82.5(ORF-O) segment across map coordinates 143,644 to 147,936 for EEHV1A(Kala, NAP18) compared to EEHV1B(Kiba, NAP14) (red) and to EEHV6(NAP35) (blue) is shown. (Data for the right-hand segment of CD-III are not yet available for EEHV6.) Arrows mark the positions of the chimeric domain boundary transitions, and the relevant DNA accession numbers are included in Table S1 in the supplemental material.

