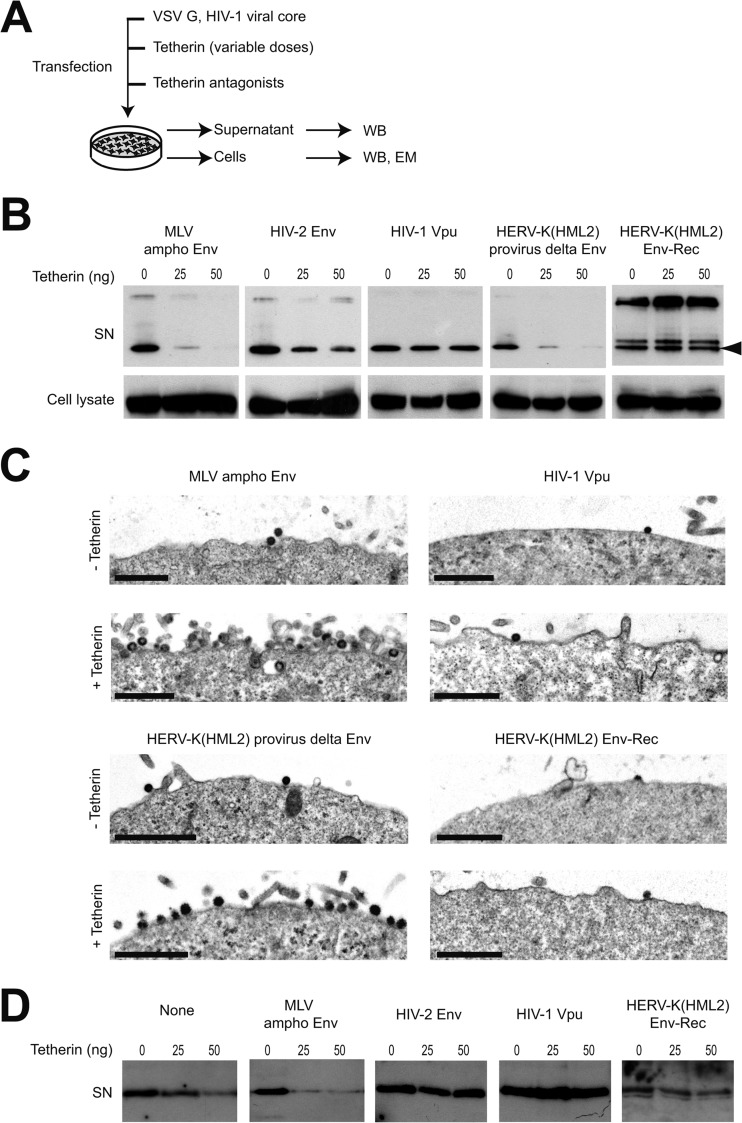
FIG 1.
Tetherin restriction is antagonized by HERV-K(HML2) Env-Rec. (A) Scheme of the experimental procedure. 293T cells were transfected with the indicated plasmids. Two days after transfection, cell supernatants were harvested and cells were either lysed to perform Western blot analysis or prepared for electron microscopy observation. (B) HIV-1 Gag protein content in neat supernatants (SN) was analyzed by Western blotting; p55 levels in corresponding cell lysates are displayed below for comparison. The nature of the potential Tetherin antagonist transfected is indicated above each gel part, and the doses of Tetherin transfected are given above each well (0, 25, or 50 ng). HIV-1 Gag p24 protein is indicated with an arrowhead. The additional bands observed in some supernatant samples (approximately 26 and 35 to 40 kDa) correspond to partially processed Gag protein. (C) Electron microscopy of cells obtained as described for panel A. Shown is a low magnification of cell membranes with viral particles observed by electron microscopy after negative staining. Images obtained with HIV-2 Env (not displayed here) were similar to those observed with HIV-1 Vpu and HERV-K(HML2) Env-Rec. Scale bars correspond to 1 μm. (D) HERV-K Gag protein content in neat supernatant was analyzed by Western blotting. The experimental procedure used was the same as that described for panel A, except the CMV-driven HERV-K(HML2) provirus defective for the envelope gene (instead of HIV-1 viral core) was transfected. Only cell supernatants were analyzed, since the anti-HERV-K(HML2) Gag antibody does not allow its specific detection in cell lysates (the signal/noise ratio is too high).

