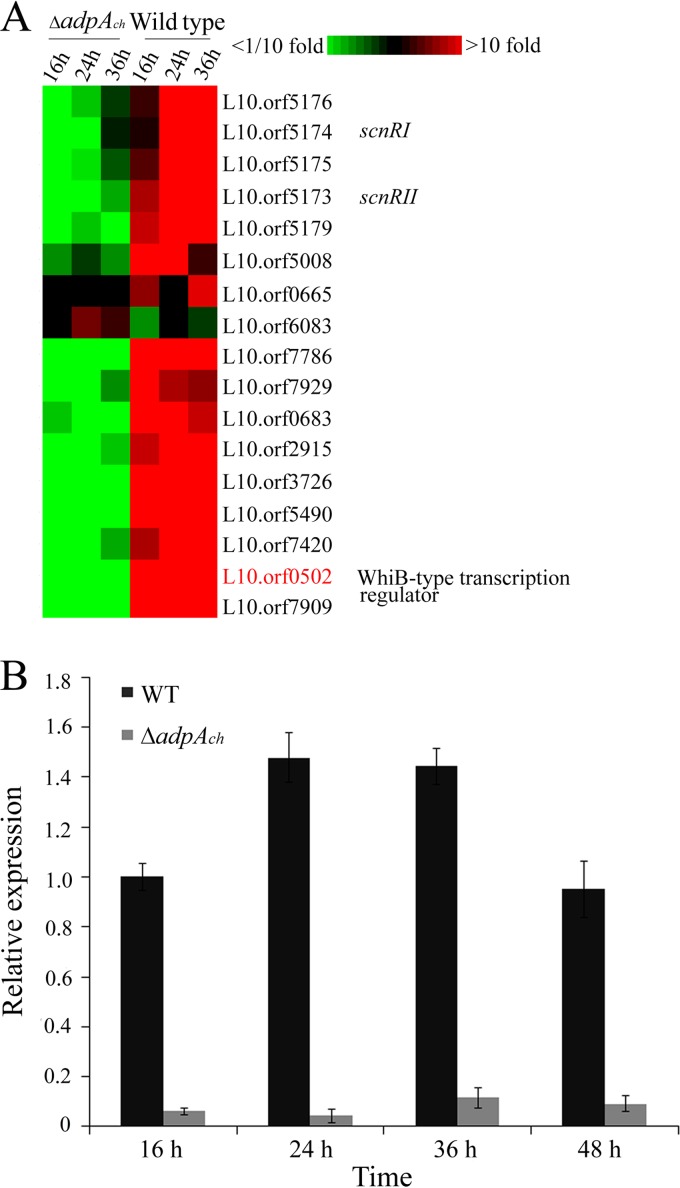
FIG 1.
Expression profiles of wblAch differentially expressed during growth of the WT strain and the ΔadpAch mutant. (A) Microarray analysis of the transcription profiles of selected genes. RNA samples were isolated at 16 h, 24 h, and 36 h during growth on YEME medium. (B) RT-PCR analysis of wblAch transcript levels in the WT strain and the ΔadpAch mutant. The expression level of wblAch is presented relative to the wild-type sample at 16 h, which was arbitrarily assigned a value of 1. The transcription level of hrdB was assayed as an internal control. Error bars were calculated by measuring the standard deviations among data from three replicates of each sample.

