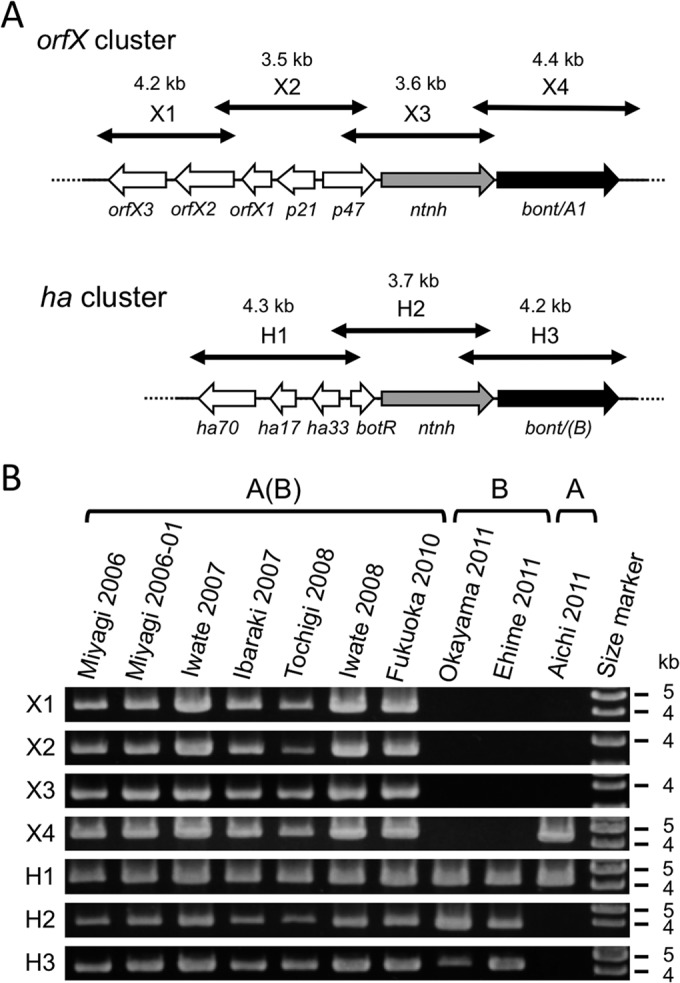
FIG 1.

PCR scanning analysis of bont gene cluster organization. (A) Schematic illustration of two bont gene clusters (orfX and ha) of type A(B) strain NCTC2916. Solid and gray arrows indicate bont and ntnh (nontoxin nonhemagglutinin) genes, respectively. Open arrows indicate genes in the orfX and ha clusters. Double-headed arrows indicate the approximate regions of amplicons in the PCR scanning analysis (X1 to X4 and H1 to H3 segments). Approximate sizes of amplicons are shown above the arrows. The PCR primer pairs used for the analysis are listed in Table 2. (B) Results of PCR scanning of 10 C. botulinum strains. Strain names and serotypes are shown at the top. The positions of the molecular size markers are shown at the right.
