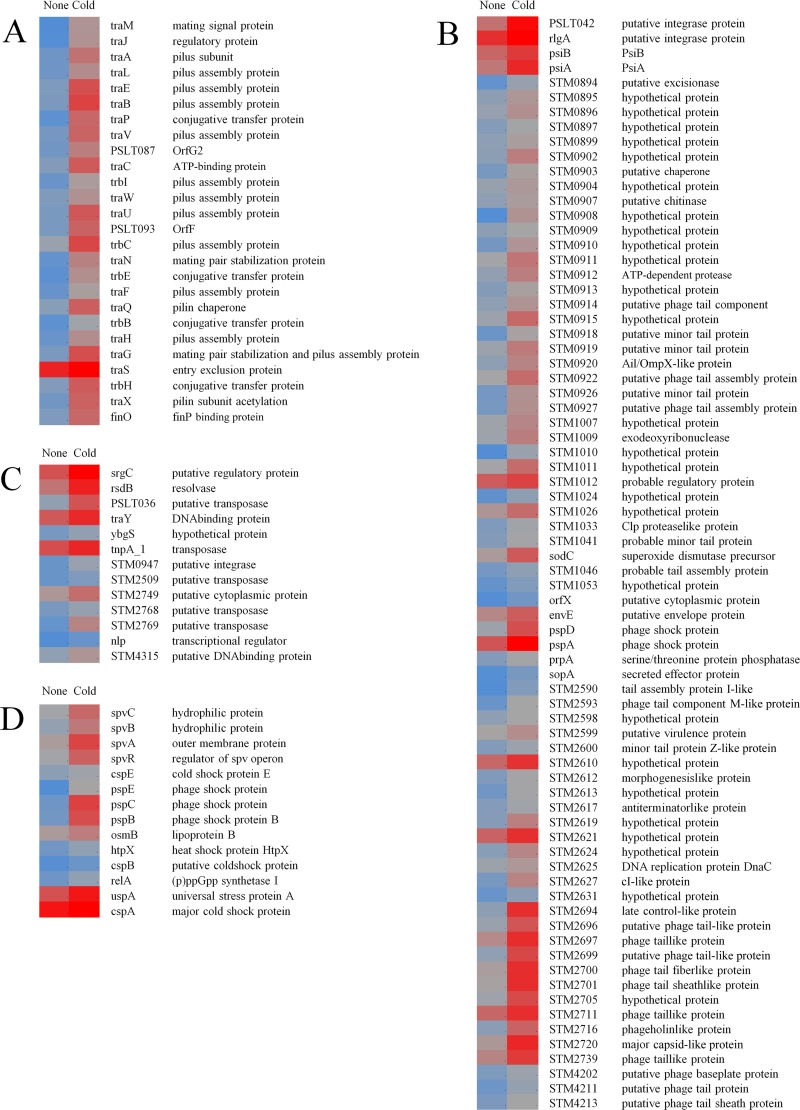
FIG 3.
Heatmap representation of genes differentially regulated (q < 0.05) in cold-stressed (5°C, 48 h) S. Typhimurium during infection of epithelial cells. (A) Plasmid (pSLT)-associated genes. (B) Prophage-associated genes. (C) DNA transposition-associated genes. (D) spv and other stress response-associated genes. The blue-gray-red color scale represents low expression intensity (2.1) to high expression intensity (11.2).

