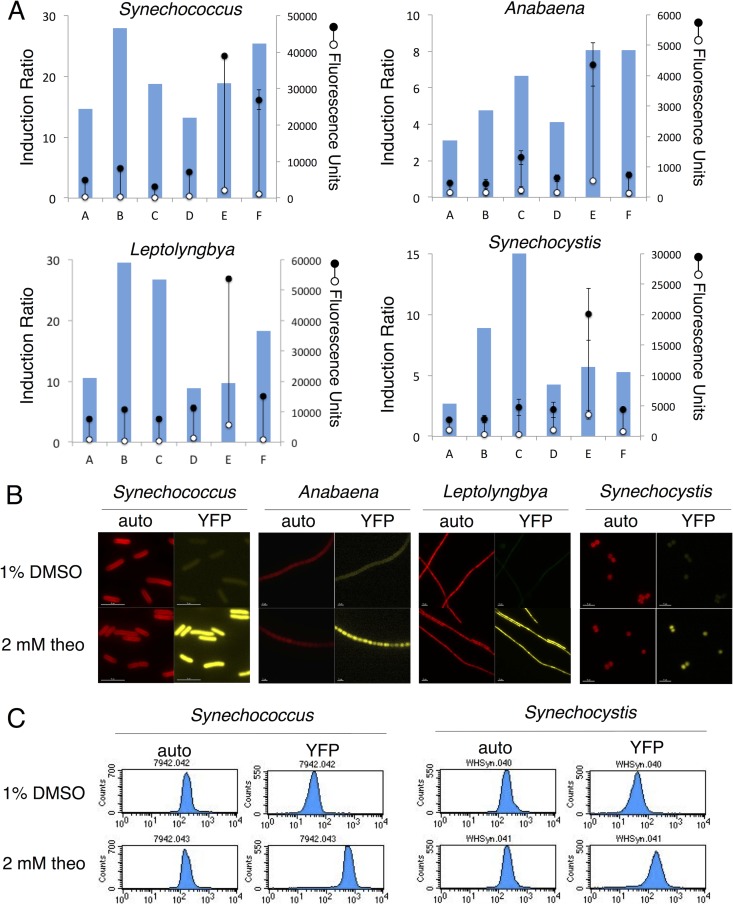
FIG 2.
Performance of theophylline-responsive riboswitch variants regulating YFP expression in model laboratory strains S. elongatus PCC 7942 and Anabaena sp. strain PCC 7120 and in model production strains Leptolyngbya sp. strain BL0902 and Synechocystis sp. strain WHSyn. Strains were treated with 2 mM theophylline or a 1% DMSO negative control for 1 day. (A) Fluorescence units (scale on the right) of YFP expression in induced (closed circles) and uninduced (open circles) cultures. The values shown are averages of three biological replicates ± the standard deviations. Columns depict induction ratios, calculated as induced values divided by uninduced values (scale on the left). Measurements were made with a fluorescence plate reader after normalization of cultures by OD750. (B) Fluorescence micrographs of induced and uninduced cultures of riboswitch F reporter strains. Images on the left show autofluorescence (auto) from photosynthetic pigments, and images on the right show YFP fluorescence. Scale bars, 5 μm. (C) Flow cytometry analysis of YFP induction in S. elongatus PCC 7942 and Synechocystis sp. strain WHSyn with riboswitch F regulation of YFP. Histograms with signal intensities on a log scale (x axis) versus the number of cells (y axis) show the distribution of autofluorescence (left, FL3), and the distribution of YFP expression (right, FL1).

