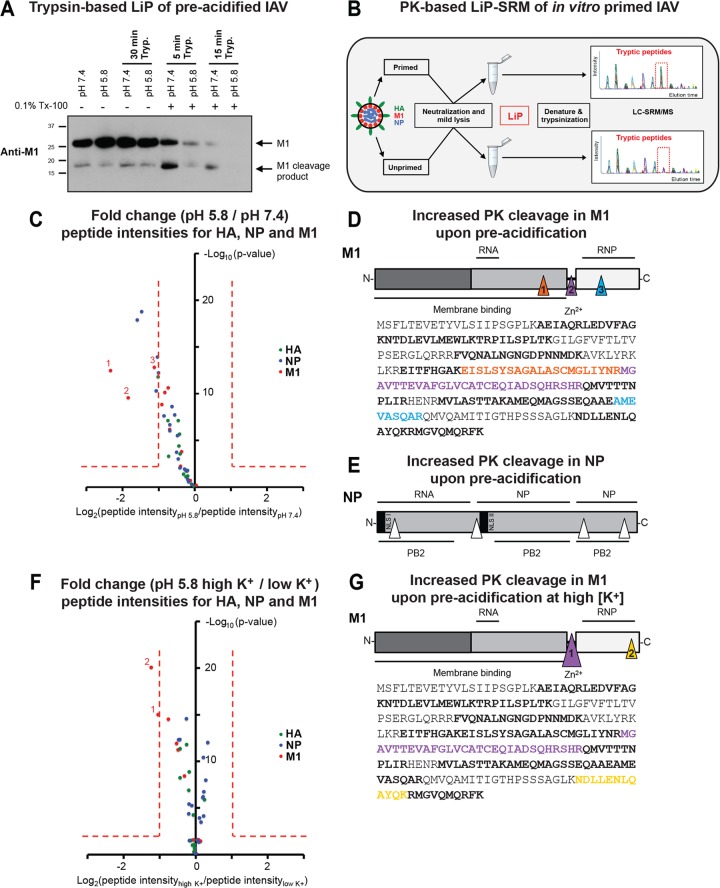
FIG 6.
Structural transitions of virion-derived IAV core proteins following priming probed by LiP. (A) Trypsin (Tryp.)-based LiP of mildly acidified X31 virions. X31 was pretreated at pH 7.4 and 5.8 for 1 h at 37°C, neutralized, and lysed with 0.1% Triton X-100 (Tx-100; 20 min at RT). Control samples were left unlysed. Trypsin was added at a ratio of 1:4 (trypsin/M1), and the mixture was incubated at RT for the indicated times. The reaction was stopped by addition of reducing SDS sample buffer containing 2 mM PMSF. Samples were resolved by SDS-PAGE and analyzed for M1 tryptic cleavage by Western blot analysis, using a monoclonal antibody against M1 (HB-64). (B) Schematic representation of LiP-SRM work flow applied to X31. Primed and unprimed virus samples were neutralized and lysed with 0.1% NP-40 (20 min at RT). LiP was performed with PK for 5 min at an enzyme/substrate ratio of 1:100. Samples were subsequently denatured and trypsinized for LC-SRM/MS analysis. The tryptic peptide intensities of primed and unprimed samples were compared. (C) Differences in susceptibility to PK cleavage are reflected by the fold changes of quantified LiP peptides from M1, NP, and HA between preacidified virus (pH 5.8, 60 min, 37°C) and control virus (pH 7.4). x axis, log2(fold change); y axis, −log10(P value). P values were obtained with three technical replicates per condition. Fold changes of >2 with a P value of <0.01 were considered significant. (D, E) Mapping of LiP peptides onto the sequence of M1 (D, bottom) and schematic visualization of PK cleavage sites in M1 (D, top) and NP (E). Triangles indicate the sites (based on LiP analysis) where a significant increase in PK cleavage was observed for preacidified virus. (F) Differences in susceptibility to PK cleavage are reflected by the fold changes of peptides quantified from M1, NP, and HA between virus preacidified in 5 mM K+ (low K+ concentration) and virus preacidified in 120 mM K+ (high K+ concentration). The same setup from panel A was adapted. (G) (Bottom) Mapping of peptides onto the sequence of M1. (Top) Triangles indicate the sites (based on LiP analysis) where an increase in PK cleavage was observed for virus treated with 120 mM K+ at pH 5.8. (D, E, and G) The schematic domain organizations of the viral proteins M1 and NP are shown. Binding sites reported for other viral components are indicated. NLS, nuclear localization signal.

