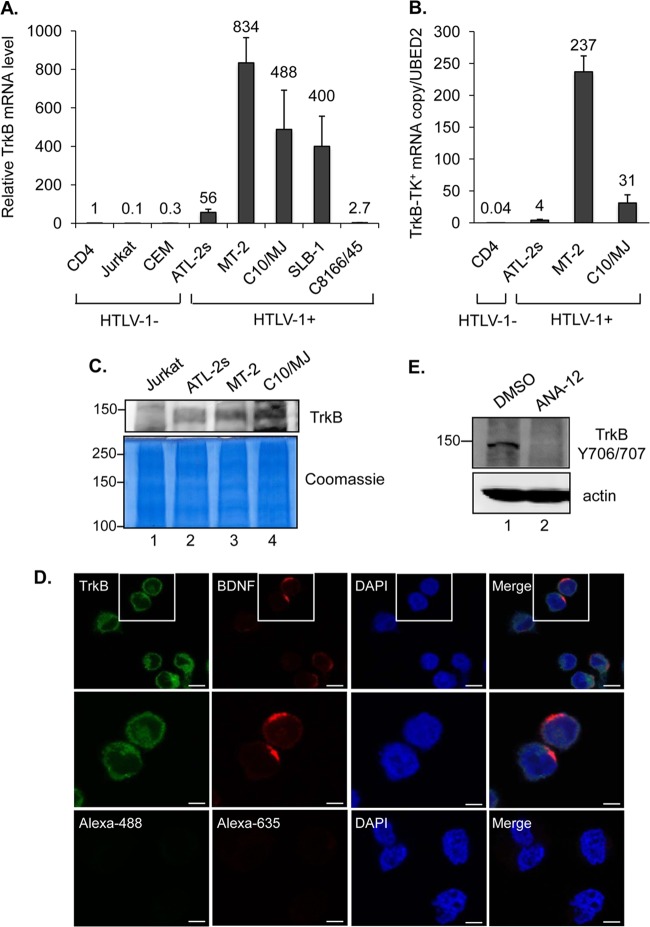
FIG 4.
HTLV-1-infected T cells express TrkB. (A) Total expression of all TrkB variants in uninfected and HTLV-1-infected T cells. The graph shows real-time PCR results as described in the legend to Fig. 2A, obtained using TrkB primers. Values correspond to three independent experiments and were calculated relative to data for the CD4+ cells (set to 1). (B) Expression of TrkB variants containing the tyrosine kinase domain (TrkB-TK+) in CD4+ and HTLV-1-infected T cells. The graph shows TrkB-TK+ mRNA copy numbers normalized to one copy of UBE2D2 mRNA. Values correspond to two independent experiments. (C) Expression of the full-length TrkB protein in HTLV-1-infected cells. Western blot analysis was performed to detect TrkB in total membrane preparations from Jurkat cells and HTLV-1-infected T-cell lines. The membrane in the upper panel was probed with a TrkB antibody. The lower panel shows the same samples stained with Coomassie blue. (D) Colocalization of TrkB and BDNF on the surfaces of HTLV-1-infected C10/MJ cells. Cells were analyzed by indirect immunofluorescence microscopy (magnification, ×40; Zeiss LSM 700 microscope) using TrkB and BDNF antibodies or with secondary antibodies alone (lower panels). Nuclei were stained with DAPI. Bars, 10 μm (upper panels) and 5 μm (middle and lower panels). (E) Western blot detection of phosphorylated TrkB in C10/MJ cells treated with DMSO or the TrkB antagonist ANA-12 (20 μM) prior to preparation of whole-cell extracts. The membrane in the upper panel was probed with a phosphorylation-specific TrkB antibody. The lower panel shows the same membrane stripped and reprobed with an actin antibody.

