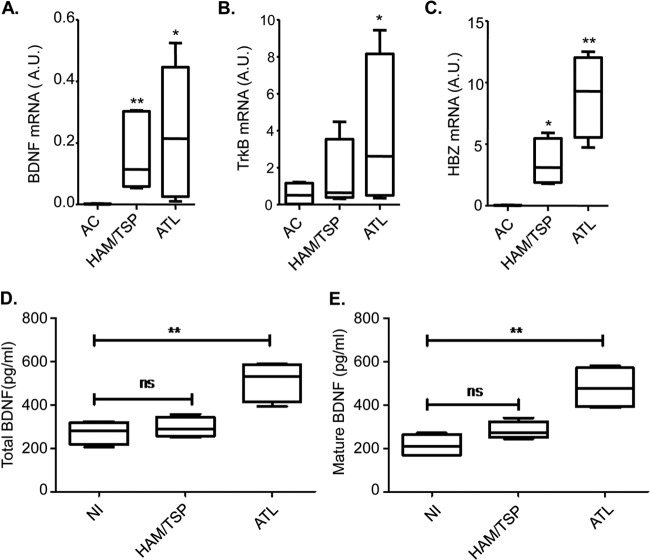
FIG 5.
Comparison of BDNF and TrkB expression among samples from HAM/TSP and ATL patients and asymptomatic carriers. Box plots show mRNA levels of BDNF (A), TrkB (B), and HBZ (C), expressed in arbitrary units (A.U.), in CD8+-depleted PBMCs from asymptomatic carriers (AC) and HAM/TSP and ATL patients following 5 days of culture (4 samples per group). Horizontal lines from the bottom to the top of each plot show the minimum value, the 25th percentile, the median, the 75th percentile, and the maximum value. *, P < 0.05; **, P < 0.005 (two-tailed Student t test). The TrkB and BDNF primers used for real-time PCR amplified all transcript variants. (D and E) BDNF concentrations in acid-treated (D) and untreated (E) specimens. Box plots show ELISA results for sera from noninfected individuals (NI) and HAM/TSP and ATL patients (4 samples per group), using the same plot indices as those described above.

