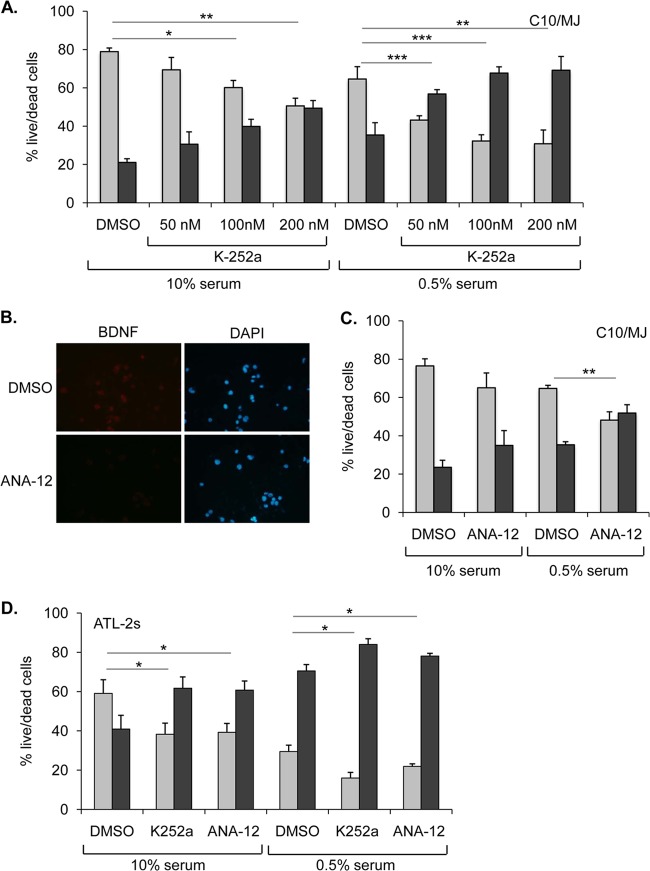
FIG 6.
Inhibition of TrkB signaling induces death of HTLV-1-infected cells. (A) C10/MJ cell survival following K-252a treatment. The graph shows ratios of live (light gray bars) to dead (dark gray bars) cells (transformed to 100% total cells) following the indicated culture conditions and treatments. Values are the mean data from three or more independent experiments, with error bars denoting standard deviations. *, P < 0.05; **, P < 0.01; ***, P < 0.0005 (two-tailed Student t test). (B) ANA-12 reduces binding of BDNF antibody to the surfaces of C10/MJ cells. Cells were seeded on coverslips in the presence of ANA-12 or DMSO and analyzed by indirect immunofluorescence microscopy (magnification, ×40; Nikon Eclipse E600 microscope) using a BDNF antibody. Nuclei were stained with DAPI. (C) C10/MJ cell survival following ANA-12 (20 μM) treatment. The graph shows ratios of live to dead cells as detailed above. Values are the mean data from three independent experiments, with error bars denoting standard deviations. **, P < 0.01 (two-tailed Student t test). (D) ATL-2s cell survival following K-252a (100 nM) and ANA-12 (20 μM) treatment. The graph shows ratios of live to dead cells as detailed above. Values are the mean data from three independent experiments, with error bars denoting standard deviations. *, P < 0.01 (two-tailed Student t test).

