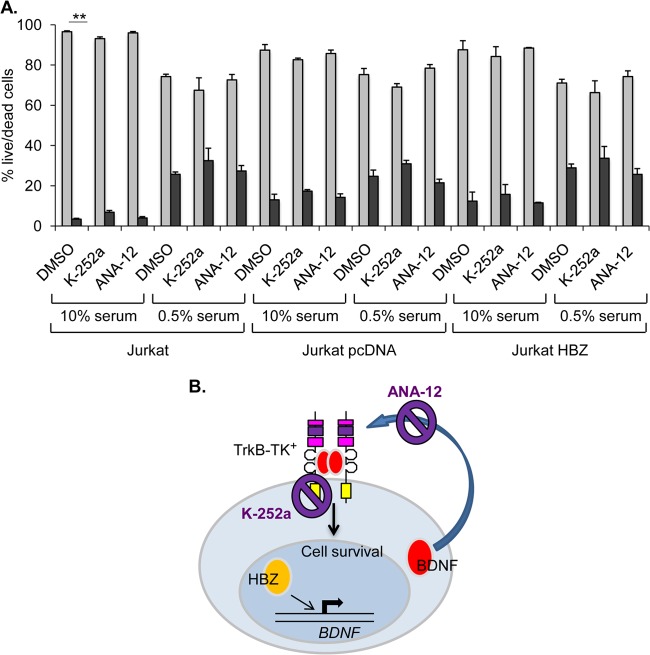
FIG 7.
Cell survival of Jurkat cells and Jurkat clones following K-252a and ANA-12 treatment. (A) Jurkat-pcDNA and Jurkat-HBZ cell survival following K-252a (100 nM) or ANA-12 (20 μM) treatment. The graph shows ratios of live (light gray bars) to dead (dark gray bars) cells (transformed to 100% total cells) following the indicated culture conditions and treatments. Values are the mean data from three independent experiments, with error bars denoting standard deviations. **, P < 0.01 (two-tailed Student t test). (B) Schematic showing the modes of inhibition of BDNF/TrkB signaling by K-252a and ANA-12.

