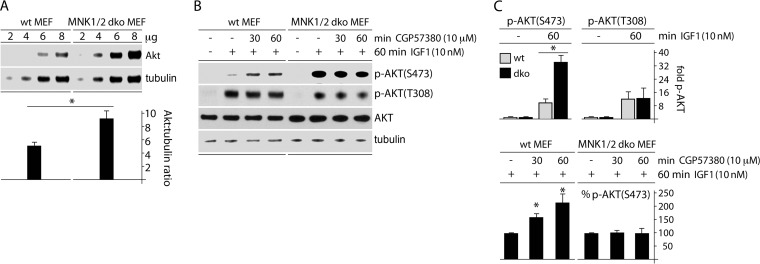
FIG 4.
MNK1 activation leads to depression of AKT phosphorylation in mouse MEFs. (A) Wt or MNK1/2 dko MEF lysates were compared by immunoblotting for total AKT versus tubulin contents. Quantitation is shown below, representing the AKT/tubulin ratio to correct for loading anomalies; the asterisk represents Student's t test (P < 0.05). (B) Wt or dko MEFs were mock treated or IGF1 treated (60 min) in the presence of DMSO (60 min) or CGP57380 (10 μM; 30 or 60 min, as indicated) and analyzed for p-AKT(S473) and p-AKT(T308) by immunoblotting. (C) (Top) Quantitation of p-AKT(S473) and p-AKT(T308) in wt and dko MEFs after treatment with IGF1 (10 nM; 60 min). The values were normalized by setting samples without IGF1 to 1. (Bottom) Quantitation of p-AKT(S473) from the experiment in panel B. Values were normalized between experiments by setting IGF1 plus DMSO (B, lanes 2 and 6 from left) to 100%. The error bars represent SEM, the asterisks directly over bars represent ANOVA-protected t tests (P < 0.05), and the asterisks over lines represent Student t tests (P < 0.05).

